A keeper counting cedi notes beside a ledger and a basin of feed at a rural homesteadUpload photo · /images/goat-pillar-hero-4.webp
Goats & Sheep · Pillar 05
Cost and Returns
Goats and sheep are the cheapest way into Ghanaian livestock, and at 2026 prices a 20-doe breeding flock (about GH¢40,700 of capital) and a 30-ram festival fattening cycle (about GH¢49,300) return revenue-cost ratios of only 1.18 and 1.13 and returns on capital of 8 and about 15 percent, at or below the 15.9 percent lending rate unless the family does the herding or a second festival cycle is run.
Cost and Returns · Pillar 05
Goats and sheep are the cheapest way into livestock farming in Ghana, and they pay when the animals are kept alive. Costs and prices move with the season, the cedi and the wider economy, so every figure below carries its date. At 2026 prices, a 20-doe goat breeding flock needs about GH¢40,700 of capital, of which about GH¢24,050 is the breeding stock and GH¢8,000 a night house, and a 30-ram festival fattening cycle about GH¢49,300 (the budgets below).
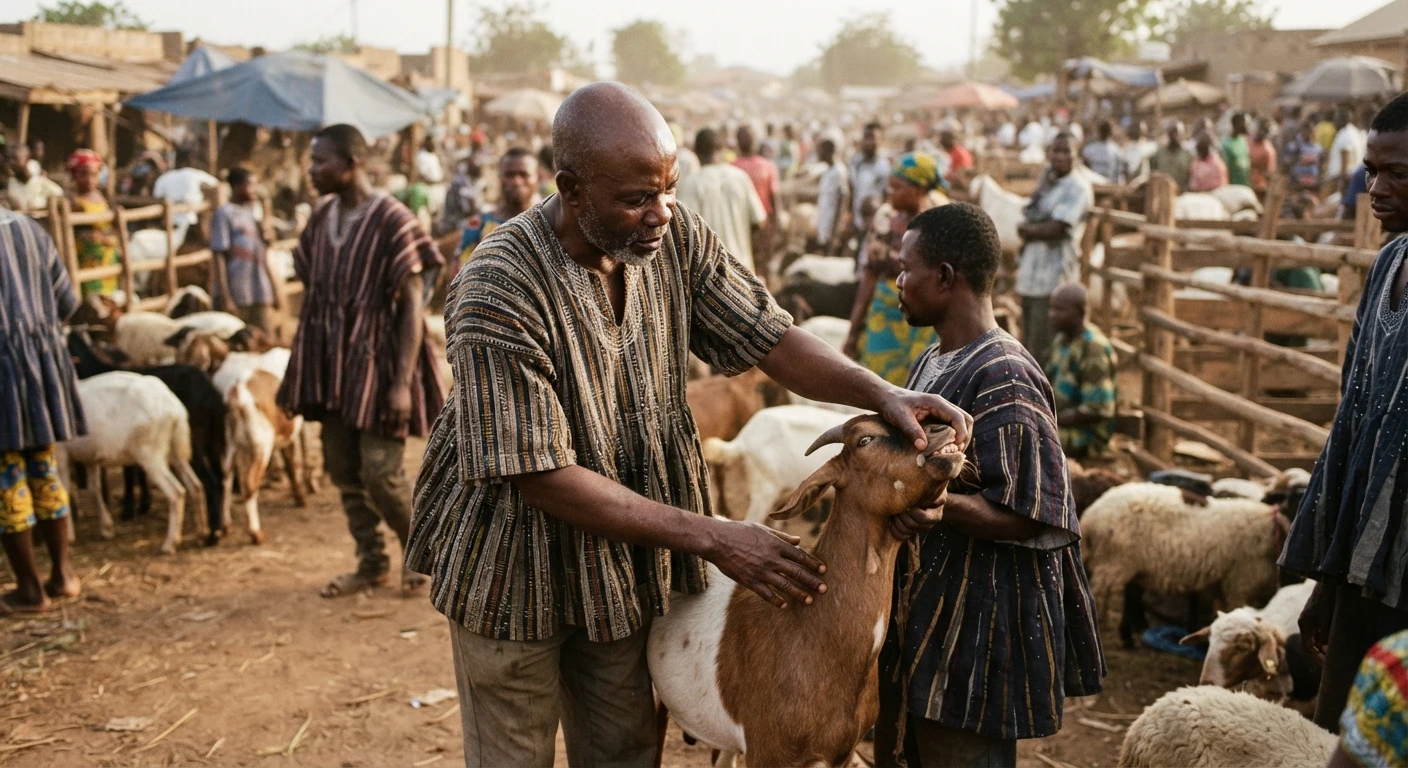
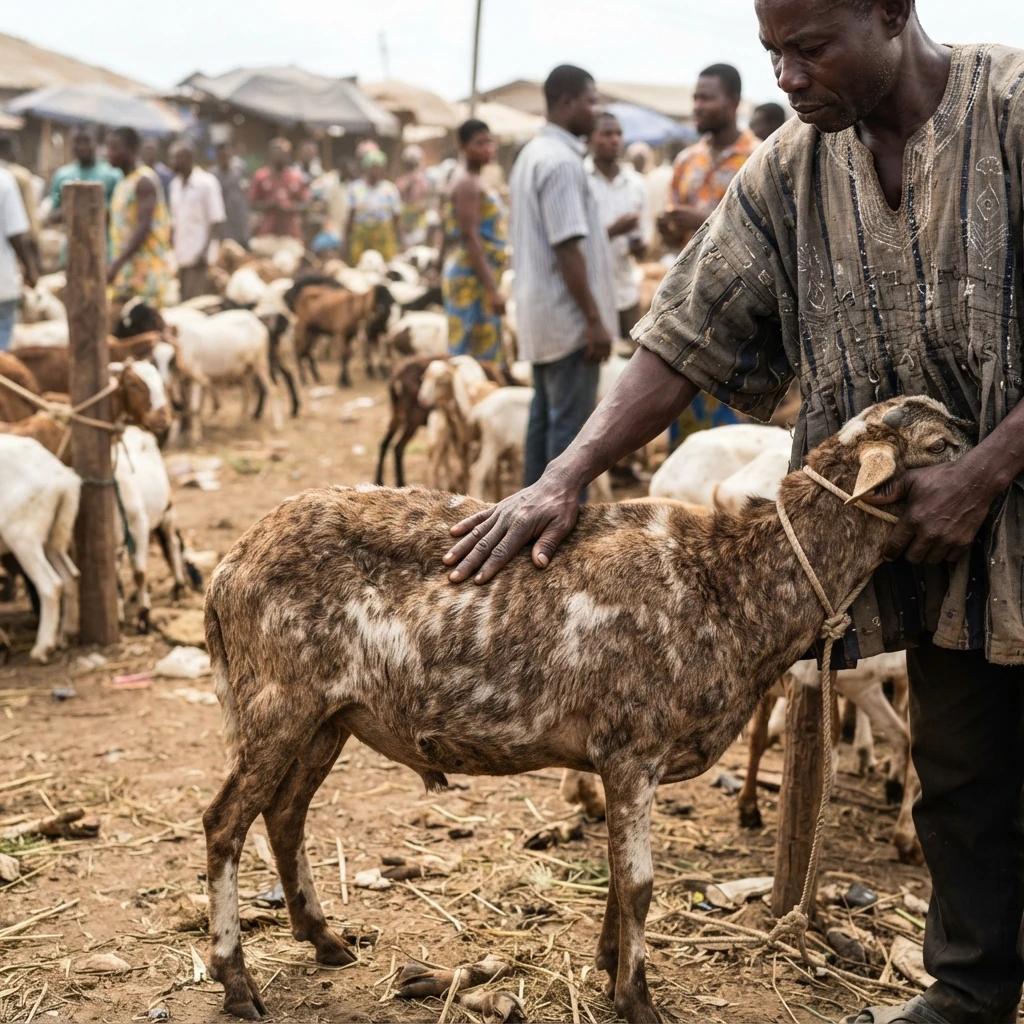
A buyer running a hand along a goat's back and inspecting its teeth before purchase at a busy Ghanaian livestock market, documentary photographUpload photo · /images/goat-cr-market-buying-inspection.webp
Priced at 2026
Every figure carries its date: costs and prices move with the season and the cedi.
GH¢40,700
capital for a 20-doe goat breeding flock at 2026 prices
GH¢49,300
capital for a 30-ram festival fattening cycle at 2026 prices
1.86
revenue-cost ratio for subsistence keepers over one year (2.33 sheep, 1.36 goats)
The returns come from two sources: the multiplication of a breeding flock, as a doe kids about three times in two years (Pillar 1), and the price premium a festival buyer pays for a finished animal. Two Ghanaian field studies found the business profitable. A study of 100 subsistence keepers in three communities of the Atwima Mponua District, Ashanti Region, found that revenue was about 1.86 times cost over one year, on flocks that rarely exceeded 40 animals and cost about GH¢17 to 18 per animal a year to keep. A 2015 survey of 284 traders in Kumasi and Tamale found that traders made money on both species.12
🐐 Where the money goes, and where it comes from 🐐
On the cost side, the biggest single item for anyone buying animals is the animals themselves. In the 2015 survey of traders in Kumasi and Tamale, buying the animals made up 84.68 percent of a trader’s cost per batch, other transaction costs 13.23 percent and regulatory charges 2.10 percent, with transport alone at 7.20 percent. On that split, paying 8.5 percent too much for the animals costs as much as the whole transport bill, so buying well is the trader’s main skill. For a producer the main costs are breeding stock, housing, feed, especially in the dry season, labour and animal health.2
On the return side, the traders’ net margin was about 24.85 percent on a goat and 17.73 percent on a sheep at 2015 prices.2
These margins are profit as a share of the selling price of one animal, a dated benchmark for how the trade splits its money; current returns depend on 2026 buying and selling prices.
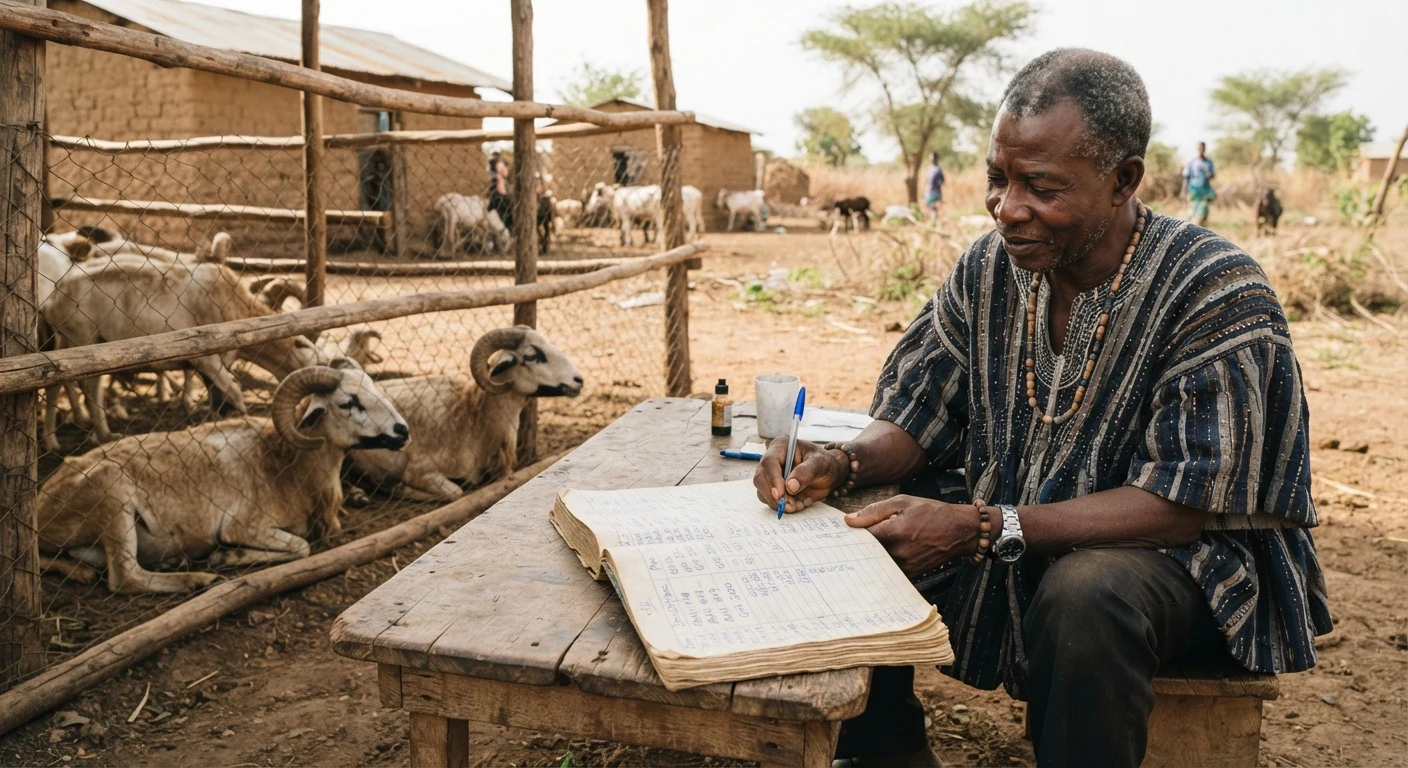
A farmer writing a purchase price and date into a handwritten ledger beside penned rams on a Ghanaian farm, documentary photographUpload photo · /images/goat-cr-cost-record-keeping.webp
85% of a trader's cost
Buying well is the trader’s main skill.
24.85%
net marketing margin, goats (2015 prices)
17.73%
net marketing margin, sheep (2015 prices)
🐐 Two business models, two cost structures 🐐
The breeding model and the fattening model have different economics. A breeding flock is a slow, compounding business: the cost is the breeding stock, housing and year-round feeding, labour and health, and the return builds as the flock multiplies and surplus animals are sold. Its enemy is mortality, because every kid or lamb lost is lost flock growth. The fattening model is a fast, repeated trade: buy lean rams in the cheap season, feed them for about twelve weeks to add weight, and sell into the festival peak. Its margin is the weight gained plus the gap between the lean-season buying price and the festival selling price, less feed and the other running costs, so its enemies are buying at the wrong price and a price crash at sale.
Table 8Cost and Return Signals, and What Stands Behind Each
Table 8: Cost and Return Signals, and What Stands Behind Each
Item
Figure
Source and caveat
Capital, 20-doe goat breeding flock (2026)
about GH¢40,700
2026 budget below: stock GH¢24,050, night house GH¢8,000 and six months' running cost
Feed per adult-equivalent a month, breeding flock (2026)
about GH¢23
2026 wheat bran and maize prices; dry-season supplement, mineral lick and bought roughage
Revenue-cost ratio (rural production, one year)
about 1.86; 2.33 sheep, 1.36 goats
Agyeman et al. (2021); 100 subsistence keepers in three communities of the Atwima Mponua District, Ashanti Region; fieldwork year not stated
Net marketing margin, goats
about 24.85 percent
Kassoh et al. (2021); 284 traders, 2015 fieldwork
Net marketing margin, sheep
about 17.73 percent
Kassoh et al. (2021); 284 traders, 2015 fieldwork
Live-animal purchase, share of trader cost (2015)
about 85 percent
Kassoh et al. (2021); 284 traders, 2015 fieldwork
Fattening cycle
about 84 days (twelve weeks)
Buy in late February, sell in the Eid week; 2026 budget below
Sources: Agyeman, Liu, Baion and Antwi (2021); Kassoh, Ohene-Yankara, Nimoh, Apaassongo and Bangura (2021), whose fieldwork was carried out in 2015, so its cedi amounts are 2015 prices; the 2026 budget below. The 2026 figures are as priced between July and September 2026 and may have changed since.
Breeding: slow, compounding
Fattening: fast, seasonal
Its enemy is the buying price
🐐 A 2026 budget, and what swings the profit 🐐
The budgets below price both businesses at 2026 prices, on one basis throughout, with each animal priced by the kilogram of live weight. The fattening cycle buys thirty lean rams of about 25 kg in the north in late February at about GH¢38 a kilogram, or GH¢950 a head,34 feeds them for twelve weeks to gain about 100 grams a day,5 and sells them at about 33 kg in the Eid week for GH¢1,800 each, about GH¢54 a kilogram.64The purchase costs GH¢28,500, feed GH¢6,706, transport in and selling GH¢3,864, labour GH¢2,743, veterinary care GH¢1,200, water and sundries GH¢300 and interest on the working capital GH¢1,353, a total of GH¢44,666, about US$3,990 at GH¢11.20 to the dollar, the Bank of Ghana rate in mid-June 2026. With 4 percent of the rams lost, 28.8 sell for GH¢51,840, a margin of GH¢7,174, or about GH¢240 a ram bought. After the pen’s depreciation the year nets about GH¢5,970 on one cycle, a revenue-cost ratio of 1.13 and about 15 percent on capital of GH¢49,300 before interest, close to the average bank lending rate of 15.9 percent in August 2026.7 A second cycle for Christmas on the same pen roughly doubles the return. The cycle breaks even at a sale price of about GH¢1,590 a ram, or a buy price of about GH¢1,140.
The breeding flock has 20 does and a buck kept semi-intensively. At about 1.4 kiddings a doe a year, 1.5 kids a kidding and four in five kids weaned, the does wean about 34 kids a year, or 1.68 a doe.8910 After losses, and after five young females are kept back to replace culled and dead does, the flock sells about 25 young goats at about 15 kg and GH¢700 each, and four cull does at GH¢900, for revenue of about GH¢21,270.111213 Feed costs about GH¢9,430 a year, half a herder at the 2026 minimum wage GH¢3,407,14veterinary care GH¢2,378, and water, tags, repairs and a share of the buck GH¢2,000. With the night house depreciated, the flock nets about GH¢3,250 a year, a revenue-cost ratio of 1.18 and 8 percent on about GH¢40,700 of capital; where the family does the herding the return is about 16 percent. The flock breaks even at about GH¢570 a young goat, or about 1.4 kids weaned per doe a year. These are steady-state figures: cash sales are lower in the first two years, because a doe’s kids take about a year to reach sale weight.
GH¢5,970
the year's net on one Eid cycle of 30 rams, after the pen's depreciation
1.13
revenue-cost ratio, festival fattening cycle
1.18
revenue-cost ratio, 20-doe breeding flock
Neither 2026 ratio should be read against the 1.86 in Table 8. That figure comes from subsistence flocks that pay no wages and buy little feed; with feed and labour costed at 2026 prices, both businesses clear their costs, but with a paid herder, or on one fattening cycle a year, neither earns more than the cost of borrowing.
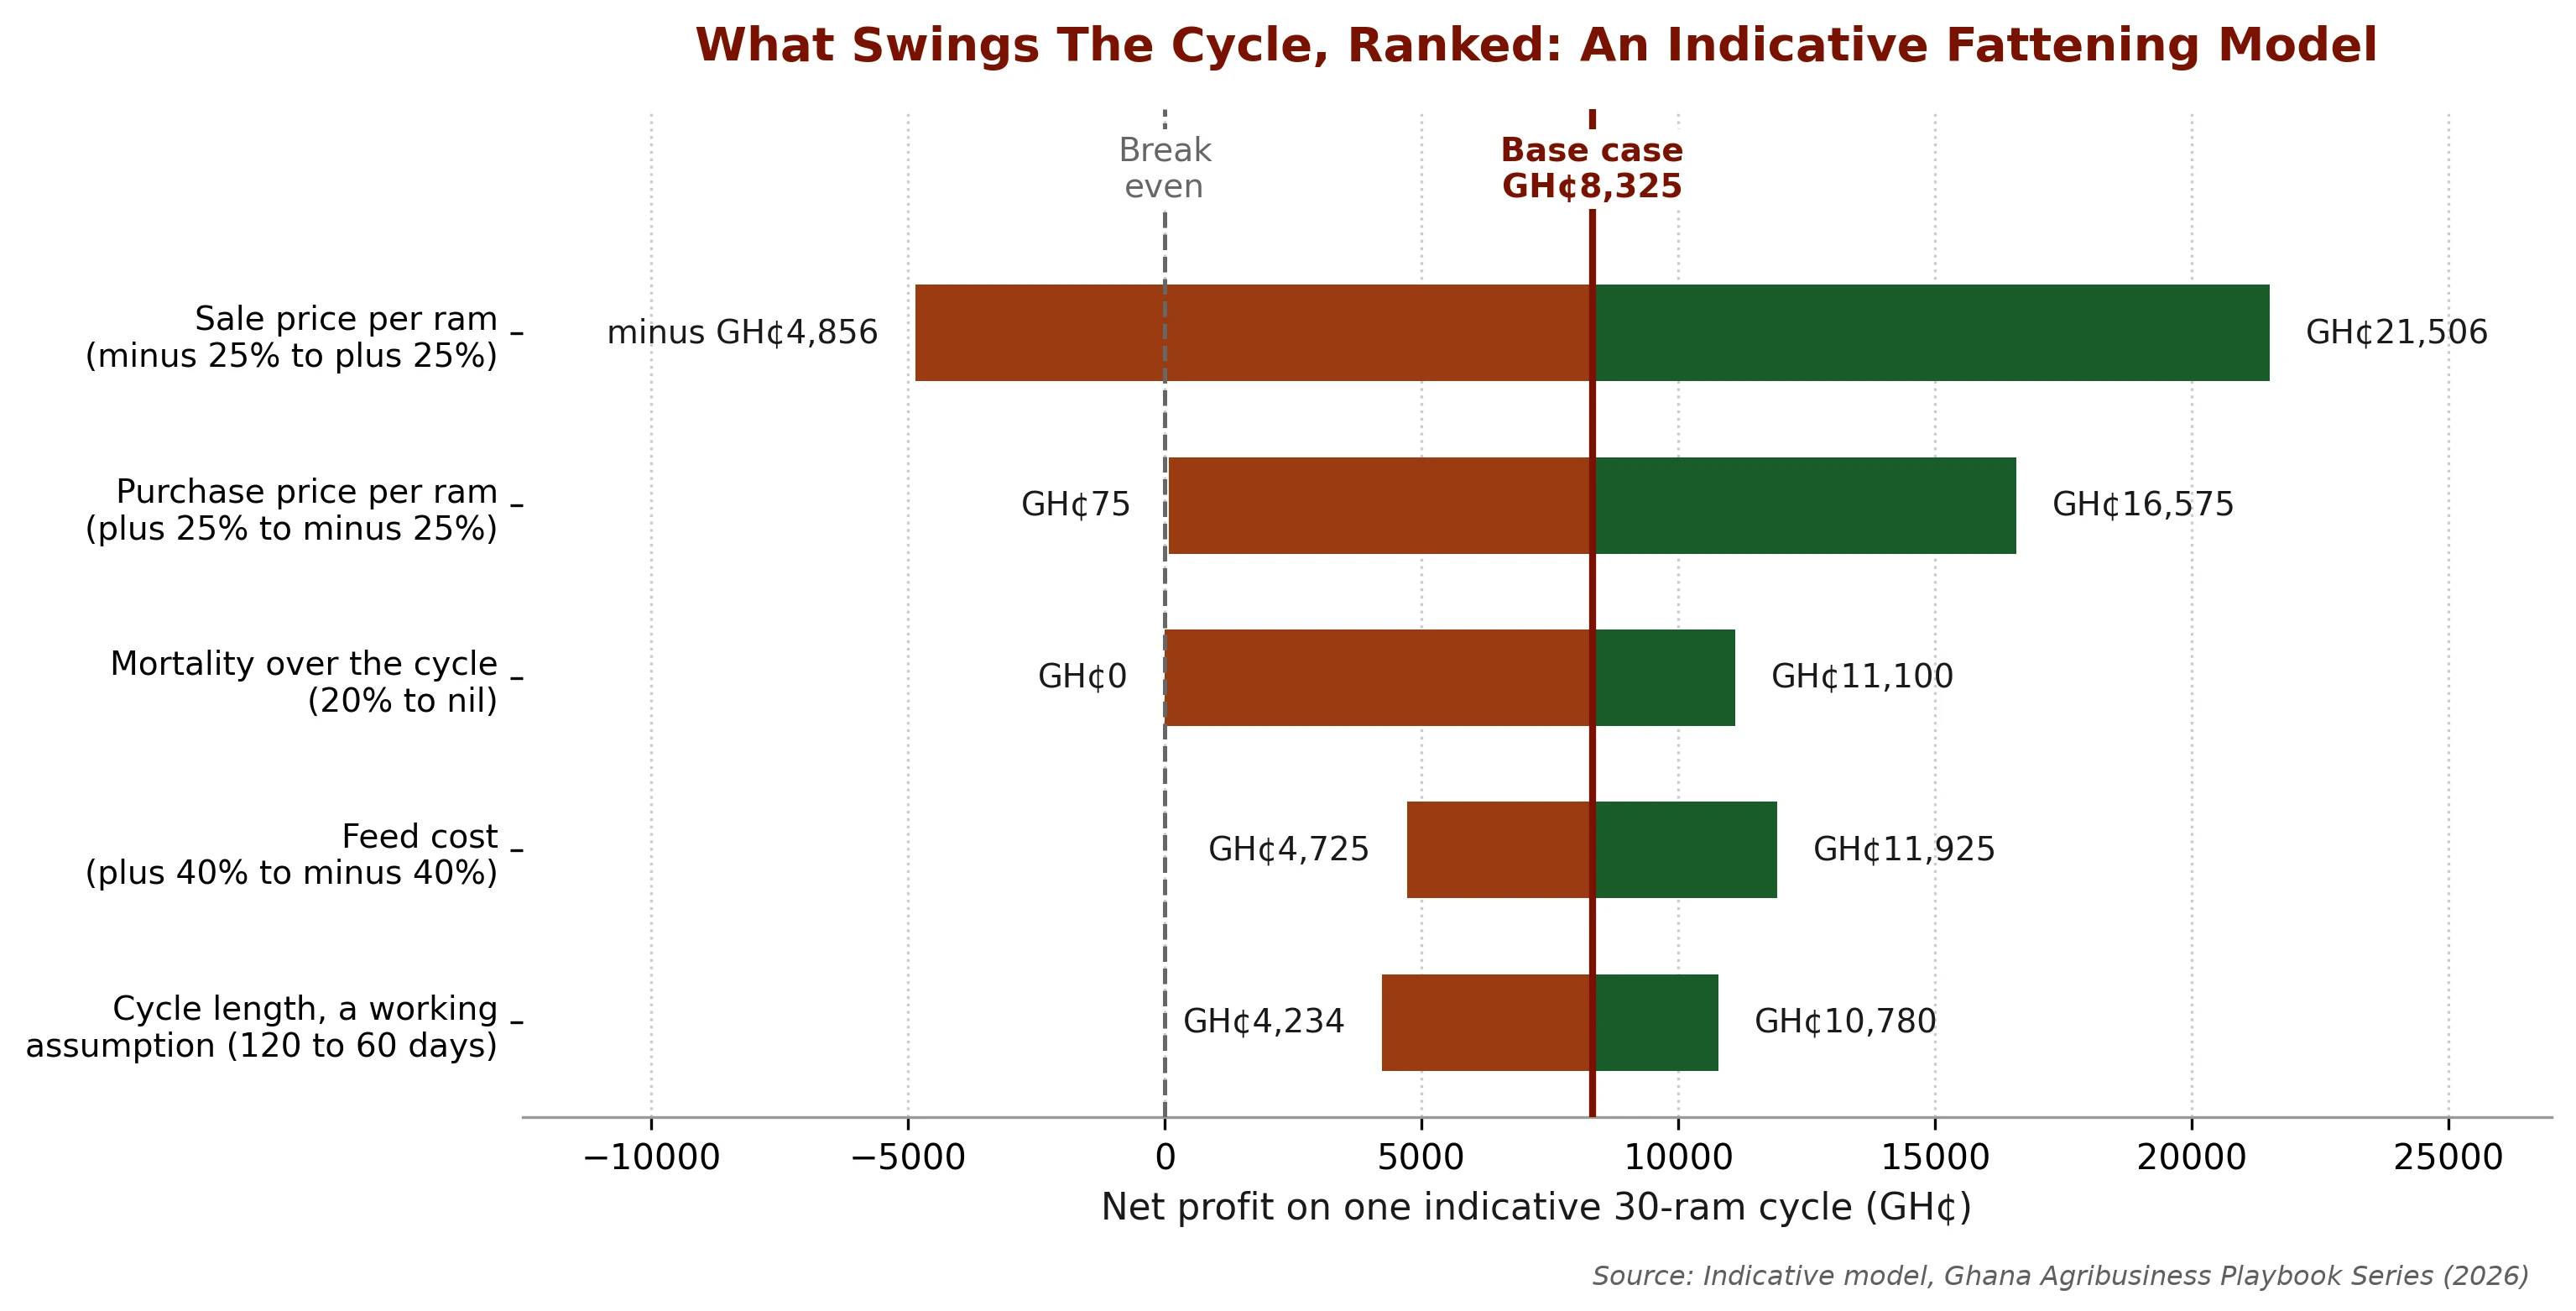
Sensitivity analysis asks how far the answer moves if one input is wrong. For the fattener the order, widest first, is sale price, purchase price, mortality, daily gain and feed cost. Prices are swung 25 percent each way, mortality from none to 15 percent, daily gain from 70 to 130 grams a day and feed 40 percent each way. The 2026 Eid week showed why the price rows matter: rams started from GH¢1,500 in Kumasi, against GH¢2,000 to 2,500 a year earlier,615 while bigger rams sold for GH¢1,500 to 3,000 in Tamale and large sheep for GH¢5,000 to 5,500 in Accra.4
Figure 5 Annual net profit on the 2026 fattening cycle of 30 rams, ranked by the width of the swing
What this shows
Price moves the cycle more than anything done inside it. A 25 percent swing in the sale price moves the year’s net across about GH¢25,900, and the same swing in the buy price across about GH¢14,800. Mortality and daily gain come next, at about GH¢8,000 and GH¢7,800. Feed, the line most operators worry about, moves it least, at about GH¢5,500, because twelve weeks of feed cost about GH¢224 against a GH¢1,800 ram.
Two of the top three variables are prices, and only one of them is a decision an operator actually takes. Sale price follows the festival calendar and the exchange rate, and a fattener who has already bought the animals cannot move it; the purchase price is set on the day of buying, and 25 percent above the base the year makes a loss. For the breeding flock the order is sale price, kids weaned per doe, feed, labour and survival after weaning, and below about 1.4 kids weaned per doe a year the flock loses money.
🐐 Run the fattening cycle yourself 🐐
The two tools below are the 2026 fattening budget above, made live. Slide the drivers a fattener can hold and watch the cost, the revenue and the year’s net move; then read the same cycle one driver at a time, ranked by how far each moves the net.
Tool 1
Does the fattening cycle clear a margin?
Slide the drivers of one twelve-week Eid cycle: the number of rams, the buy price a kilogram of live weight for a 25 kg lean ram, the Eid sale price a ram, the feed cost a ram and the mortality rate. Type your own quotes into the boxes to test any cycle.
GH¢44,666
Cycle cost, about US$3,988; the purchase is 64% of it
GH¢51,840
Revenue, 28.8 of 30 rams sold at Eid
1.13
Revenue-cost ratio, revenue over cycle cost plus the pen’s depreciation (1.13 at the base)
GH¢1,593
Break-even sale price a ram for the year
+GH¢5,974
Annual net on one cycle, after GH¢1,200 of pen depreciation · margin on the cycle GH¢7,174, GH¢239 a ram bought · about 15% on capital of GH¢49,313 before interest
At these numbers one Eid cycle nets GH¢5,974 for the year, a revenue-cost ratio of 1.13. Each GH¢100 on the sale price moves the margin by about GH¢2,880, and each GH¢1 a kilogram on the buy price by about GH¢777. On the base case one cycle a year earns about the cost of borrowing; a second cycle for Christmas on the same pen roughly doubles the return.
Base case (2026 prices, live-weight basis): 30 lean rams of 25 kg bought in the north in late February at GH¢38 a kg (GH¢950 a ram), fed 84 days at 100 g a day to 33.4 kg and sold in the Eid week at GH¢1,800 a ram, about GH¢54 a kg, with 4 percent of the rams lost. Feed is 0.5 kg of concentrate a day at GH¢3.93 a kg (wheat bran, maize and soybean meal), 0.8 kg of roughage at GH¢0.60 a kg and 10 g of mineral lick at GH¢21.50 a kg, about GH¢224 a ram; vet care GH¢40 a ram, transport in GH¢100 a ram, selling GH¢30 a ram sold, one attendant at 1.5 times the GH¢21.77 daily minimum wage (GH¢2,743 a cycle) and water and sundries GH¢10 a ram. Interest is charged at the August 2026 average lending rate of 15.9 percent for 84 days on the purchase, transport in and half the running cost, and the GH¢6,000 pen is written off over five years.3456147 Defaults give revenue of GH¢51,840, a cycle cost of GH¢44,666, a margin of GH¢7,174 and an annual net of about GH¢5,970. US$ at GH¢11.20, the Bank of Ghana rate in mid-June 2026. Indicative planning values. Figures are as reported between July and September 2026 and may have changed since.
Tool 2
What swings the net most
The same cycle, one driver at a time. Each bar is how far the year’s net moves when that driver is swung across the range the workbook’s Sensitivity sheet uses, holding the others where you left them: prices 25 percent each way, mortality from none to 15 percent, daily gain from 70 to 130 grams a day and feed 40 percent each way.
1. Sale price at EidGH¢25,920
What the survivors fetch in the Eid week, swung 25 percent each way. It follows the festival calendar and the exchange rate, and a fattener who has already bought cannot move it. In the 2026 Eid week rams started from about GH¢1,500 in Kumasi, against GH¢2,000 to 2,500 a year earlier, while bigger rams sold for GH¢1,500 to 3,000 in Tamale.
2. Buy price a kilogram of the lean ramGH¢14,771
The purchase is about two-thirds of the cycle cost. It is the widest swing the fattener decides, and 25 percent above the base the year makes a loss. Buying in the lean months, in lots from several sellers, is where a fattener earns the margin.
3. Mortality in the cycleGH¢7,965
From no losses to 15 percent of the rams bought. A dead ram loses its whole sale price and saves only its GH¢30 selling cost. Quarantine, PPR vaccination on arrival and a deworming calendar keep it down.
4. Daily gainGH¢7,823
From 70 to 130 grams a day over the 84 days, at the same price a kilogram. Faster gain puts more kilograms on every ram sold.
5. Feed cost a ramGH¢5,463
Feed swung 40 percent each way. Twelve weeks of feed cost about GH¢224 against a GH¢1,800 ram, so feed moves the year's net least of the five drivers.
GH¢5,463
What a 40 percent swing in feed does to the year’s net, against GH¢7,965 for mortality
GH¢7,823
What daily gain from 70 to 130 grams a day does
Price moves the cycle more than anything done inside it. At the base case a 25 percent swing in the sale price moves the year’s net across about GH¢25,900, and the same swing in the buy price across about GH¢14,800. Mortality and daily gain come next, at about GH¢8,000 and GH¢7,800. Feed moves it least, at about GH¢5,500. Two of the top three are prices, and only the buy price is a decision the fattener takes; the sale price follows the festival calendar and the exchange rate.
Swings are the difference in annual net between the low and high case of each driver, as in the Sensitivity sheet of the Goats and Sheep Cost and Returns Model v3. On the base case they are GH¢25,920 for sale price, GH¢14,771 for buy price, GH¢7,965 for mortality, GH¢7,823 for daily gain and GH¢5,463 for feed.
🐐 Inflation and a moving market 🐐
Costs and prices in this business move with the wider economy, and they move both ways. Ghana’s inflation fell from 23.5 percent in January 2025 to 3.2 percent in March 2026, the lowest since the consumer price index was rebased in 2021, and stood at 5.0 percent in August 2026, with food inflation at 3.0 percent.161718 The Bank of Ghana held its policy rate at 14 percent in July 2026, and the average bank lending rate was about 15.9 percent in August.197 The cedi rose strongly in 2025, then lost about 9.5 percent against the US dollar between January and mid-July 2026.19
5.0%
inflation in August 2026, down from 23.5% in January 2025
15.9%
average bank lending rate, August 2026
GH¢180
a 50 kg bag of Ghanaian maize, March 2026, against GH¢350 a year earlier
Three inputs carry most of this movement for goats and sheep. Feed: a 50 kg bag of Ghanaian maize sold for about GH¢180 in March 2026, against GH¢350 a year earlier, after a large harvest, while soybean meal, much of it imported, and wheat bran, milled from imported wheat, follow the cedi and world prices.20Animal health: Ghana’s Veterinary Services Directorate makes some livestock vaccines at home, but not the PPR vaccine, so its price, like that of most veterinary medicines, follows the cedi.21 Live animals: Burkina Faso suspended exports of cattle, sheep and goats from 8 May 2026, yet more than 5,000 animals reached the Kumasi Abattoir by 21 May against about 3,000 a year earlier, and rams there started from GH¢1,500, against GH¢2,000 to 2,500 a year earlier, a fall traders put down largely to the stronger cedi, while prices rose in Accra.226
Re-cost every input at the start of each season from current quotes. Keep a cash buffer that covers both a fall in the selling price and a rise in feed and drug costs over one cycle. Where a buyer will agree, prefer a contract that fixes the price in advance or ties it to the cost of feed.
🐐 Where a fattener can cut cost, and by how much 🐐
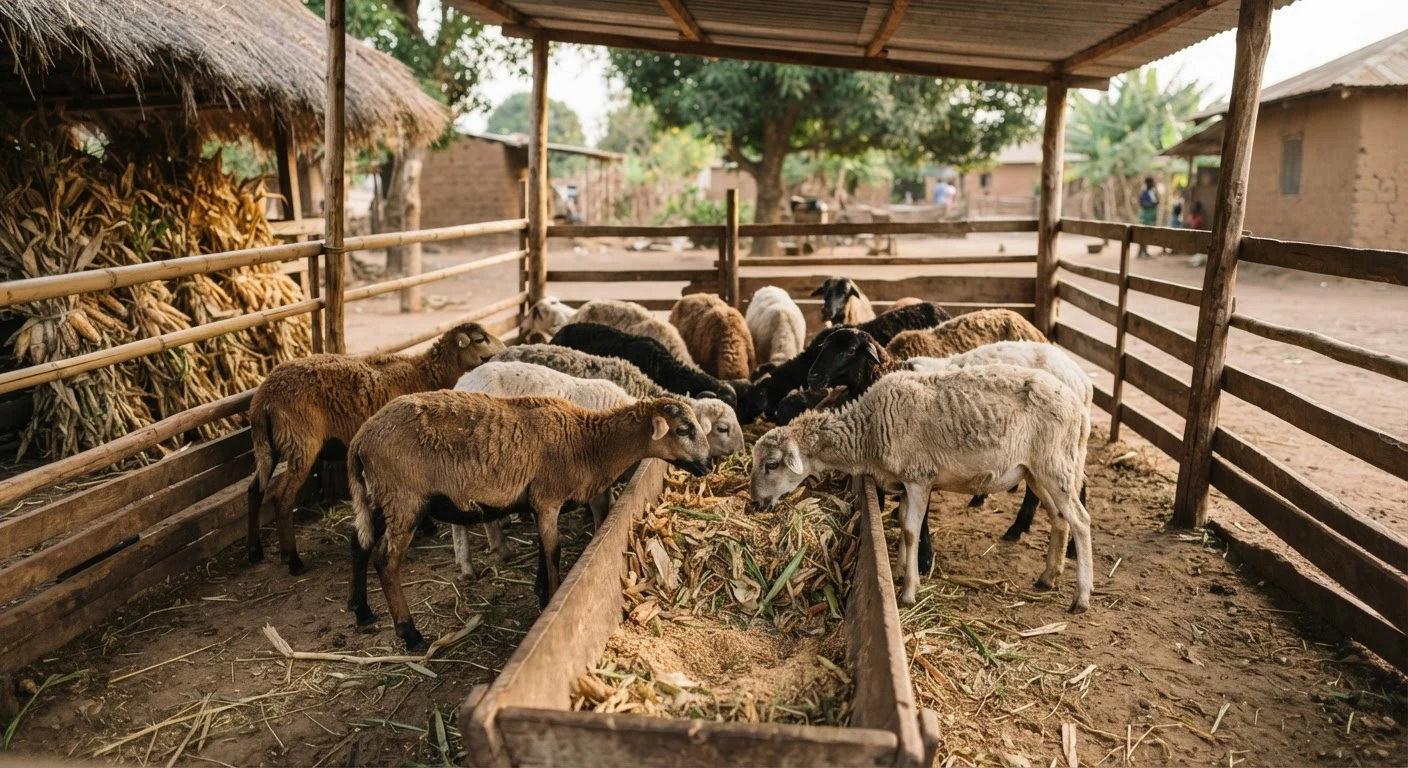
Rams penned for a fattening cycle being fed stored crop residue and concentrate feed from a trough, rural Ghana, documentary photographUpload photo · /images/goat-cr-fattening-pen-feeding.webp
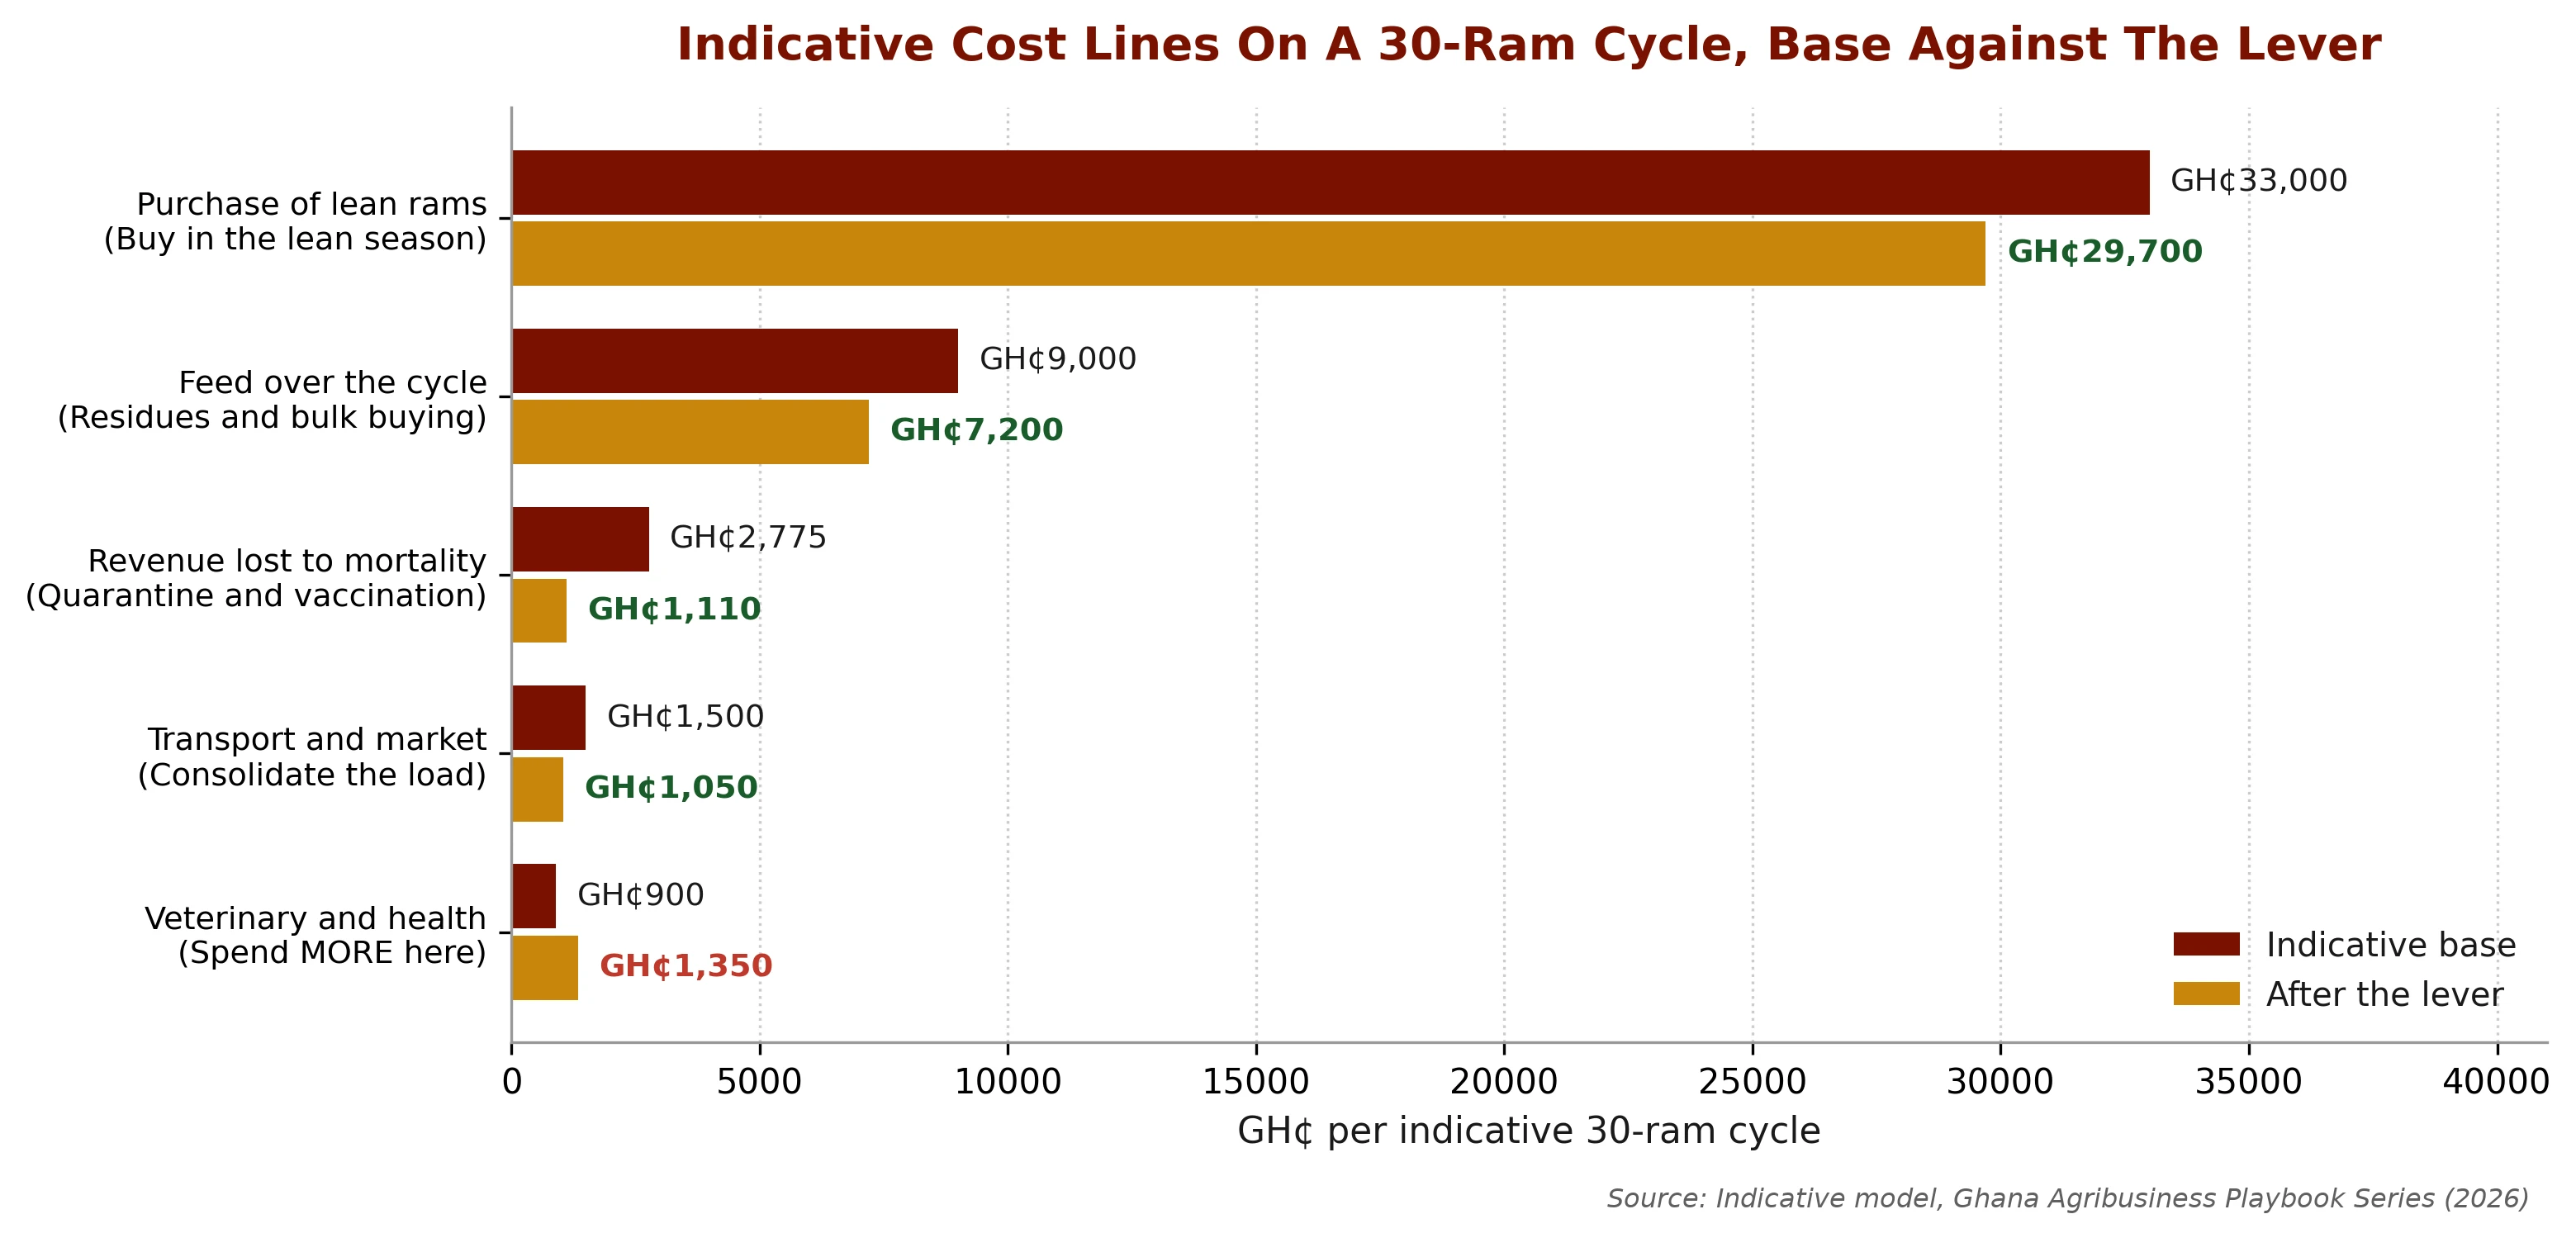
The table below shows which costs an operator can change, and what each change is worth on the same cycle. Sale price is the widest swing in the chart above and is left out of the table because a fattener who has already bought the animals can choose when to sell, but not what the market pays on the day.
Purchase price
Mortality and loss
Feed
GH¢2,954
gain from buying 10 percent cheaper, with the interest saved, the largest single lever
GH¢6,570
the four gains together a cycle, against a margin of about GH¢7,174
Table 9Where a Fattener Can Cut Cost, on the 30-Ram Cycle at 2026 Prices
Table 9: Where a Fattener Can Cut Cost, on the 30-Ram Cycle at 2026 Prices
Cost line
Base, 2026
The lever
Gain per cycle
What to record
Animal purchase
GH¢28,500, 30 rams at GH¢950
Buy in the lean months rather than three weeks before a festival, and in lots from several sellers on several days
GH¢2,954 on a 10 percent better entry, with the interest saved
Record price, date and seller for every animal bought over a full year
Mortality and loss
GH¢2,160 of revenue at 4 percent
Quarantine incoming animals, vaccinate against PPR on arrival, and deworm on a calendar
GH¢1,062 if mortality falls to 2 percent
Count deaths by week and age class; an annual figure hides when the loss happens
Veterinary and health
GH¢1,200
Spend more here: the quarantine, the arrival vaccination and the deworming calendar are what buy the mortality gain above
Part of the cost of the mortality gain
Cost every treatment against the deaths avoided in the same batch
Feed over the cycle
GH¢6,706
Buy wheat bran and maize at harvest or in a strong-cedi month, bale crop residues, and store them (Pillar 4)
GH¢1,366 on a 20 percent reduction
Weigh what is fed and weigh the animals fortnightly
Transport and selling
GH¢3,864
Consolidate loads with neighbouring keepers and avoid the festival haulage peak
GH¢1,192 on a 30 percent reduction
Log every payment made on the road against the animals carried
Working-capital timing
GH¢43,313 tied up for about twelve weeks
Stagger purchases and sales so the pen is never idle, for example a goat cycle for Christmas
About one extra cycle a year on the same capital
Date every purchase and sale, and track days held
All base and gain figures come from the 2026 fattening budget above. The four gains come to about GH¢6,570 a cycle, against a margin of about GH¢7,174.
Figure 6 The same cycle, base cost against what each lever leaves
What this shows
The same cycle, asked a different question. Sensitivity says what moves profit; this says what an operator can do about it. Buying 10 percent cheaper is worth about GH¢2,950 a cycle, more than any other lever, and cutting losses from 4 to 2 percent recovers about GH¢1,060 that never appeared as a cost line. Both cost attention more than money.
🐐 The hidden return: savings, insurance and manure 🐐
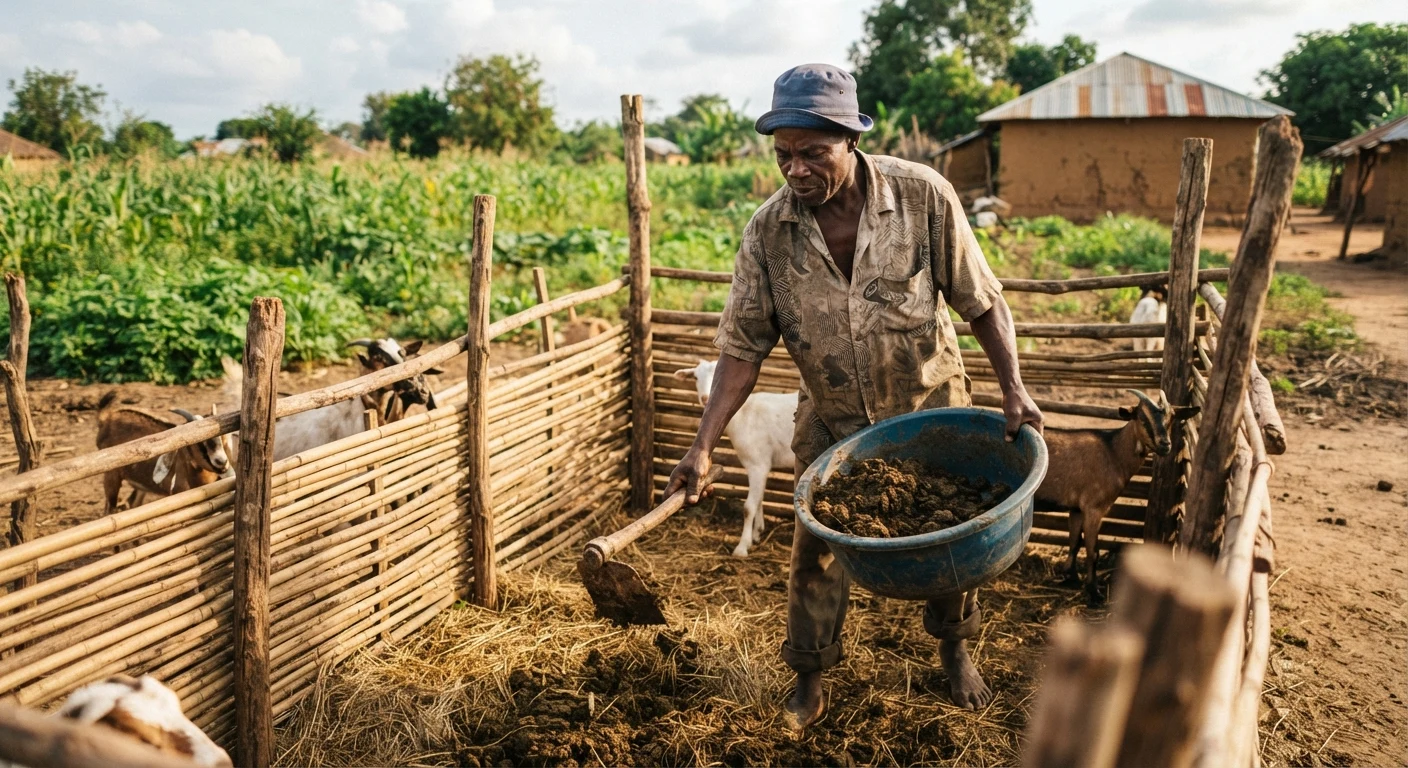
There is a part of the return that does not show up as cash, and it explains why so many households keep goats and sheep even when they do not run them as a business. A study in northern Ghana found that at least 60 percent of the net benefit from sheep and goat production came in non-cash forms: the animal as a savings account that can be sold in an emergency, as insurance for unforeseen needs such as medical bills and school fees, and as a source of manure that saves on fertiliser23. For a commercial entrant this is useful context: it helps explain why many owners sell only when they need cash, and it points to manure as a real secondary product on a mixed crop and livestock farm.23
A farmer gathering goat manure into a basin from a fenced pen for use as compost on cropland, rural Ghana, documentary photographUpload photo · /images/goat-cr-manure-collection.webp
More than cash
60%+ of the benefit is non-cash: savings, insurance, manure.
60%+
of net benefit to traditional keepers in northern Ghana is non-cash: savings, insurance, manure
🐐 The risks that sit inside the cost and returns decision 🐐
Buying badly
VERY HIGH
What it is
paying too much for the animal at purchase, which on this cost structure is the largest and least recoverable error a fattener can make.
Evidence
Buying the live animal is about 85 percent of a trader’s marketing cost2, and on that split an error of 8.5 percent at purchase already costs as much as the entire transport bill for the batch. In the 2026 budget the purchase is about two-thirds of the fattening cycle’s cost, and a buy price 25 percent above the base turns the year’s profit into a loss.
Who it hits
the fattener and the trader hardest, and the new entrant hardest of all, because valuing an animal on the hoof is a skill learned by repetition and paid for in mistakes.
How to manage it, and the opening
buy in small lots until the eye is trained, weigh or measure rather than estimate where a scale or a girth tape is available, walk away from a market day rather than fill a truck at a bad price, and keep a written record of purchase price against final sale weight for every animal, which is the only way the skill compounds.
Selling into a soft window
HIGH
What it is
bringing finished animals to market when prices are falling, which the 2026 record shows can happen even in a festival week.
Evidence
Sale price moves the 2026 fattening budget more than any other input. In the 2026 Eid week rams started from about GH¢1,500 in Kumasi, against GH¢2,000 to 2,500 a year earlier, while prices rose in Accra, Tamale and Wa in the same Eid window, so a national assumption about festival prices is not safe4.
Who it hits
anyone holding stock to a date rather than to a price, and worst of all a borrower whose repayment is timed to a single sale.
How to manage it, and the opening
spread sales across more than one market and more than one week, agree a price before trucking where a buyer will commit, and hold enough feed to carry animals past a bad week rather than selling into it.
🎯 Openings: where the money is 🎯
01
Buying agent, paid on purchase discipline. Buying the animals was about 85 percent of a trader's cost in the 2015 Kumasi and Tamale survey, and brokers and commission agents already took about 2 percent of each batch. An agent who values animals on the hoof, works a circuit of markets and is paid a share of the saving sells a skill and needs little capital.
02
Contract fattening on someone else's animals. The fattener's biggest exposure is the purchase price of stock. Fattening animals owned by a trader or an institutional buyer removes the purchase-price risk and turns the business into a fee on weight gained, which is easier to finance.
03
Festival-window finishing. Both the sensitivity analysis and Pillar 2's price record say sale price moves the answer more than any cost line. A finishing operation timed to the Eid and Christmas windows, buying thin animals in the cheap months, is a strong use of the same capital, provided the buyer and the market are chosen market by market.
04
A record-keeping service, then a costing service. Published Ghanaian cost studies are few and dated, and lenders want per-cycle records. A service that keeps clean per-cycle records for a group of fatteners builds a cost dataset that lenders will pay for.
05
The digital and AI angle. Simple AI is already within reach here. A phone-photo weight estimate from a handful of images, of the sort now common in cattle and pig systems elsewhere, would let a buying agent value an animal without a scale, which is the judgement that decides the profit. Tape-based goat and sheep weight calculators are already on phone app stores; a photo-based version calibrated on West African Dwarf and Djallonke animals would be new. It needs a set of weighed and priced animals to learn from.
06
Dry-season feed supply. Feed is the largest running cost of a breeding flock, and the dry-season gap is the main production problem in the north, where Professor Terry Ansah of the University for Development Studies called in April 2025 for investment in feed made from groundnut, cowpea and pigeon pea residues and browse.24 With a 50 kg bag of maize at about GH¢180 in March 2026, half its price a year earlier, a local mixer who bales residues at harvest and sells a ready supplement in the dry season has cheap inputs to work with.20
07
Bulk-buying groups. Maize fell by about half in a year, while soybean meal, wheat bran and veterinary drugs follow the cedi. A group of keepers that buys feed and drugs together at harvest or in a strong-cedi month, and stores them, locks in the low point for every member.
08
Fattening-pen rental. Near Kumasi, keepers who confined their animals fully lost fewer of them but earned no more than free-range keepers, because of higher running costs.25 Renting a built, ventilated pen and feeding space to fatteners for the twelve weeks before Eid spreads that fixed cost across several users.
09
Vet care by subscription. PPR vaccination coverage more than halved, from 34.5 to 13.1 percent, in the year keepers had to pay, and the Feed Ghana Programme’s vaccination plan for sheep and goats had not started by August 2026.2627 A vet or trained para-vet who charges a flat fee per animal a year for a vaccination and deworming calendar turns an irregular cost into a planned one.
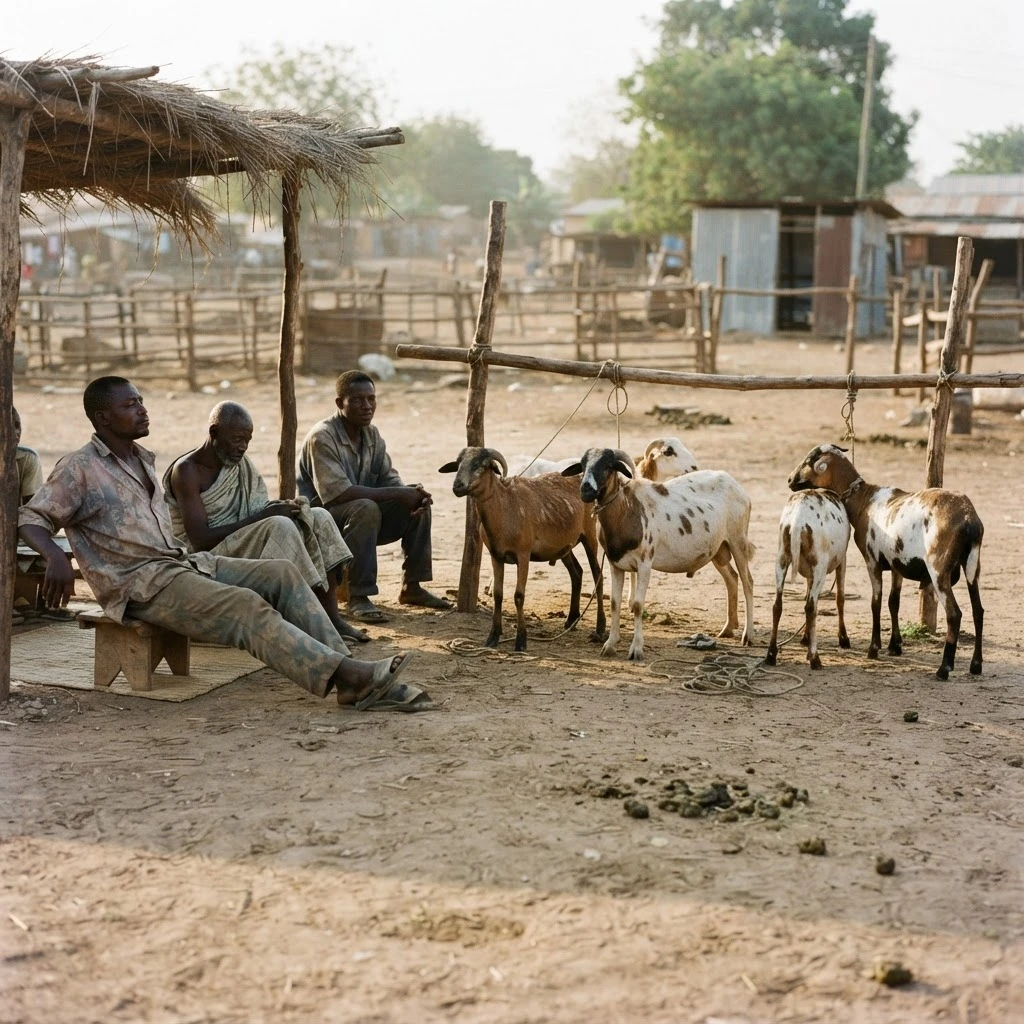
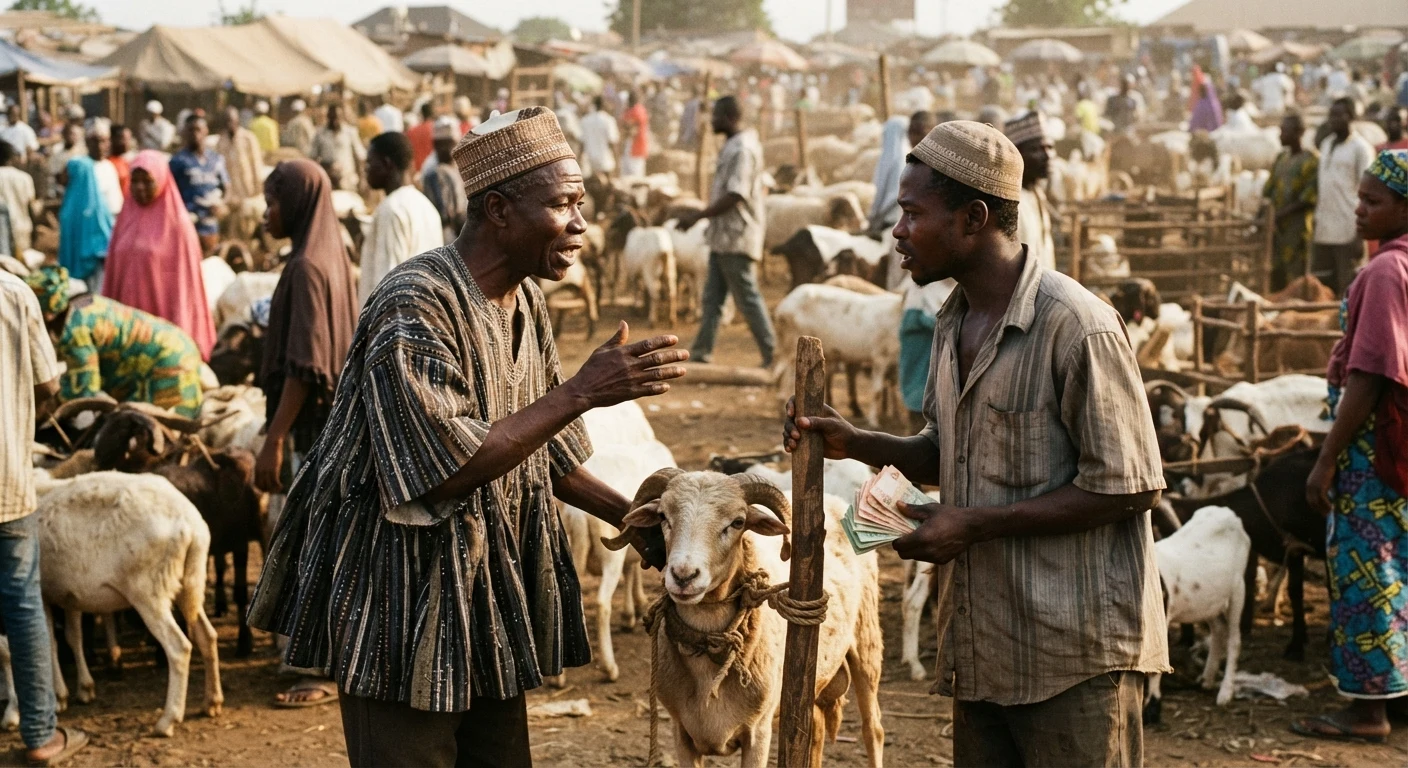
A seller and a buyer negotiating over a finished ram at a busy festival livestock market ahead of Eid, Ghana, documentary photographUpload photo · /images/goat-cr-festival-market-selling.webp
🐐 Key takeaways 🐐
01
Goats and sheep are the cheapest entry into livestock farming; at 2026 prices a 20-doe breeding flock needs about GH¢40,700 of capital and a 30-ram fattening cycle about GH¢49,300.
02
The business pays, but only just at 2026 prices: revenue-cost ratios of 1.18 for a 20-doe breeding flock and 1.13 for a festival fattening cycle, with returns on capital of 8 percent for the flock and about 15 percent for one fattening cycle, at or below the 15.9 percent lending rate, unless the family does the herding or a second festival cycle is run.
03
Older field studies found a ratio of about 1.86 for subsistence keepers and trader margins of about 25 percent on goats and 18 percent on sheep in 2015.
04
Buying the live animal is about 85 percent of a trader's cost, so buying well is the key skill in any trading or fattening venture, and an error of 8.5 percent at purchase already costs as much as the whole transport bill.
05
At 2026 prices, fattening profit swings most on sale price, then purchase price, then mortality and daily gain, then feed. Sale price is the one an operator who has already bought cannot move; purchase price, mortality, feed and transport all carry a lever. Buying 10 percent cheaper is worth about GH¢2,950 a cycle, the largest single lever.
06
Plan on a fattening cycle of about twelve weeks and record the real length of your first cycle.
07
In northern Ghana at least 60 percent of the benefit to traditional keepers is non-cash: savings, insurance and manure. Many owners sell only when they need cash.
Written for each reader
🐐 Practitioner intelligence 🐐
Hover any card to pause and lift it.
For students
The cost and returns picture is a lesson in why livestock are kept for more than cash, and in reading farm economics: revenue-cost ratios, marketing margins and the difference between cash and non-cash benefits. The sensitivity exercise above is worth reproducing by hand before trusting anyone else's spreadsheet.
For entrepreneurs
Build your numbers on current quotes for animals, feed and drugs, and treat the field studies as dated context: a revenue-cost ratio near 1.86 for subsistence keepers, who pay no wages and buy little feed, and trader margins of 18 to 25 percent in 2015. Decide which model you are running: breeding, slow and compounding, where mortality is the enemy, or fattening, fast and seasonal, where the buying price is the enemy. Keep records from day one so you have your own budget, and run purchases and sales through a single mobile money line where you can, since a dated digital payment trail is the cheapest transaction record this sector currently lacks and the first thing a lender will ask to see.
For investors
Ask for a cost and returns budget built on current local prices and the keeper's own records before investing. The economics are real but thin in the literature, so the highest-value due diligence is a costed budget for the specific system, breed and district, and the sensitivity work above shows where that diligence pays: on purchase price, mortality and daily gain more than on feed.
For ecosystem actors
Public support can de-risk the economics through the GIRSAL credit guarantee, which covers up to 70 percent of the principal of an eligible loan, interest excluded28, and through the Feed Ghana Programme, whose sheep and goat support (subsidised breeding stock, restocked breeding stations and a vaccination plan) had not started by August 2026 and was due to launch in September 2026.27 The sector also needs a published small-ruminant enterprise budget, updated by MoFA each season, so that entrants can plan, and lenders can price a borrower, against current numbers.
For students
The cost and returns picture is a lesson in why livestock are kept for more than cash, and in reading farm economics: revenue-cost ratios, marketing margins and the difference between cash and non-cash benefits. The sensitivity exercise above is worth reproducing by hand before trusting anyone else's spreadsheet.
For entrepreneurs
Build your numbers on current quotes for animals, feed and drugs, and treat the field studies as dated context: a revenue-cost ratio near 1.86 for subsistence keepers, who pay no wages and buy little feed, and trader margins of 18 to 25 percent in 2015. Decide which model you are running: breeding, slow and compounding, where mortality is the enemy, or fattening, fast and seasonal, where the buying price is the enemy. Keep records from day one so you have your own budget, and run purchases and sales through a single mobile money line where you can, since a dated digital payment trail is the cheapest transaction record this sector currently lacks and the first thing a lender will ask to see.
For investors
Ask for a cost and returns budget built on current local prices and the keeper's own records before investing. The economics are real but thin in the literature, so the highest-value due diligence is a costed budget for the specific system, breed and district, and the sensitivity work above shows where that diligence pays: on purchase price, mortality and daily gain more than on feed.
For ecosystem actors
Public support can de-risk the economics through the GIRSAL credit guarantee, which covers up to 70 percent of the principal of an eligible loan, interest excluded28, and through the Feed Ghana Programme, whose sheep and goat support (subsidised breeding stock, restocked breeding stations and a vaccination plan) had not started by August 2026 and was due to launch in September 2026.27 The sector also needs a published small-ruminant enterprise budget, updated by MoFA each season, so that entrants can plan, and lenders can price a borrower, against current numbers.
Where this connects. The mortality that ranks third in the fattening sensitivity above is bought down by the vaccination and biosecurity regime costed in Pillar 3. The feed cost that moves the answer less than either price, but decides whether an animal reaches weight inside the cycle, is a housing and dry-season storage decision taken in Pillar 4. And the margin structure measured here in the trading layer runs along the whole chain in Pillar 6, where the question of who captures the value is settled.
Footnotes
Agyeman, Opoku, Shuai Liu, Yagbasuah Maada Baion, and Charles Kwasi Antwi. "Profitability Analysis of Small Ruminants (Goat and Sheep) Production in Rural Communities of Ghana." Agricultural and Forestry Economics and Management 4, no. 1 (2021): 33-39. https://doi.org/10.23977/agrfem.2021.040107.↑
Kassoh, Fallah Samuel, Kwasi Ohene-Yankara, Fred Nimoh, Ibrahim Latif Apaassongo, and Raymond Manna Bangura. "Market Performance of Small Ruminant in Kumasi and Tamale of Ghana." American Journal of Economics 11, no. 3 (2021): 84-94. http://article.sapub.org/10.5923.j.economics.20211103.02.html.↑
Karbo, N., W. S. Alhassan, S. A. Adongo, and J. Bruce. "Small Holder Lamb Fattening Based on Crop Residues and Agro-Industrial By-Products in Northern Ghana." Ghana Journal of Agricultural Science 30, no. 1 (1997): 31-38. https://doi.org/10.4314/gjas.v30i1.1975.↑
Ayizanga, R. A., P. K. M. Tecku, and F. Y. Obese. "Growth and Reproductive Performance of West African Dwarf Goats at the Animal Research Institute, Katamanso Station." Ghana Journal of Agricultural Science 52, no. 1 (2018): 43-53. https://www.ajol.info/index.php/gjas/article/view/179638.↑
Wilson, R. Trevor. Small Ruminant Production and the Small Ruminant Genetic Resource in Tropical Africa. FAO Animal Production and Health Paper 88. Rome: Food and Agriculture Organization of the United Nations, 1991. https://www.fao.org/4/t0376e/t0376e.pdf.↑
Hagan, B. A., J. K. Nyameasem, A. Asafu-Adjaye, and J. L. Duncan. "Effects of Non-genetic Factors on the Birth Weight, Litter Size and Pre-weaning Survivability of West African Dwarf Goats in the Accra Plains." Livestock Research for Rural Development 26, no. 1 (2014): article 13. https://www.lrrd.org/lrrd26/1/haga26013.htm.↑
Adams, Faizal, Kwasi Ohene-Yankyera, Robert Aidoo, and Camillus Abawiera Wongnaa. "Economic Benefits of Livestock Management in Ghana." Agricultural and Food Economics 9 (2021): 17. https://doi.org/10.1186/s40100-021-00191-7.↑
Adams, Faizal, Amos Mensah, Ebenezer Donkor, Ayat Ullah, Antoinette Simpah Anim-Jnr, James Osei Mensah, Seth Etuah, and Gifty Boakye Appiah. "Income over Loss: How Management Systems Lower Mortality and Increase Farm Incomes from Small Ruminants in Urbanizing Africa." Small Ruminant Research 253 (2025): 107626. https://doi.org/10.1016/j.smallrumres.2025.107626.↑
Yaawie, Titus, Rita Agyekumwaa Asante, Samuel Dapaa, George Akowuah, Samuel Bosoka, Magdalene Odikro, Emmanuel Adetor, Jabir Seidu, Saeed Jabactey Abdullah, and Samuel Sackey. "Analysis of Peste des Petits Ruminants Surveillance and Vaccination Coverage Data, Eastern Region, Ghana, 2025." Journal of Interventional Epidemiology and Public Health 9, no. ConfProc7 (2026): 012. https://doi.org/10.37432/JIEPH-CONFPRO7-0012.↑