Ghana Agribusiness PlaybookGoats & Sheep
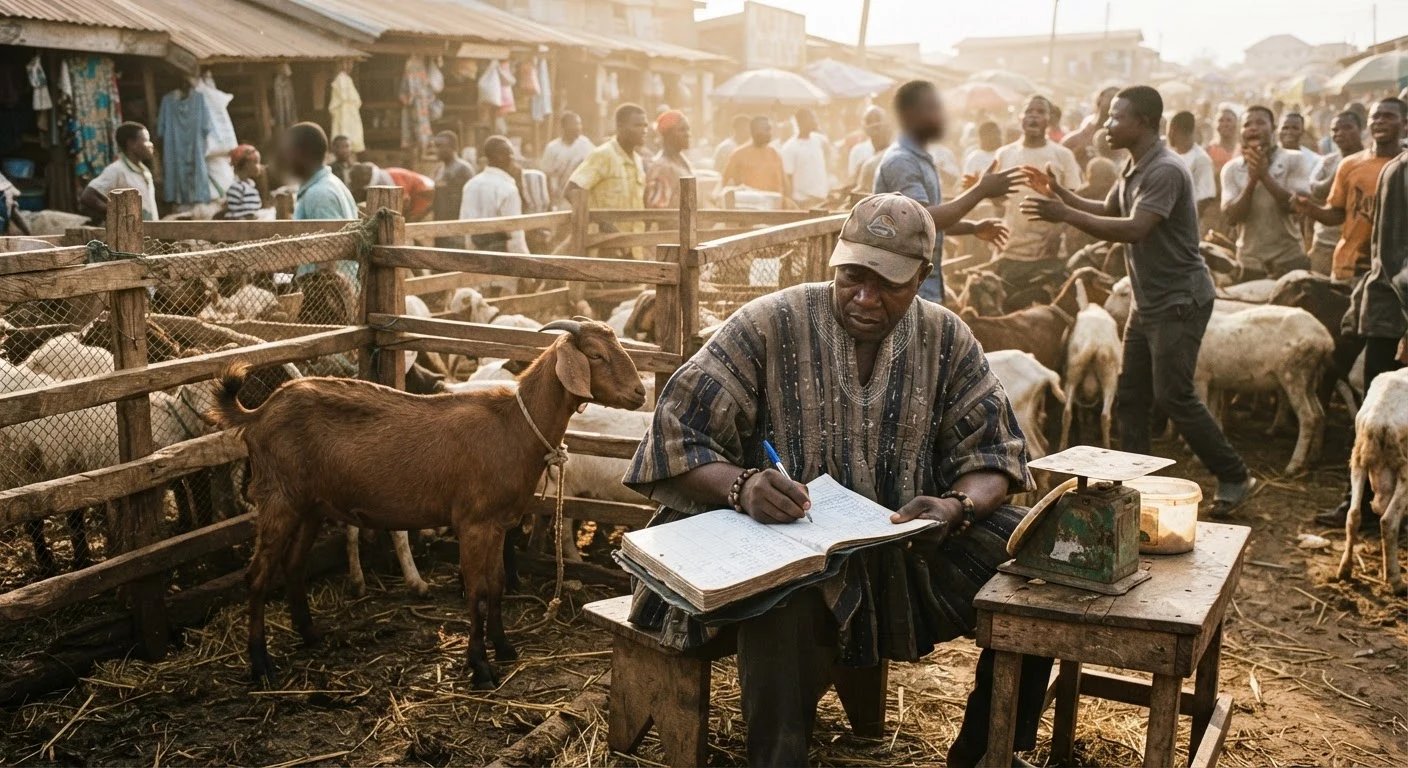
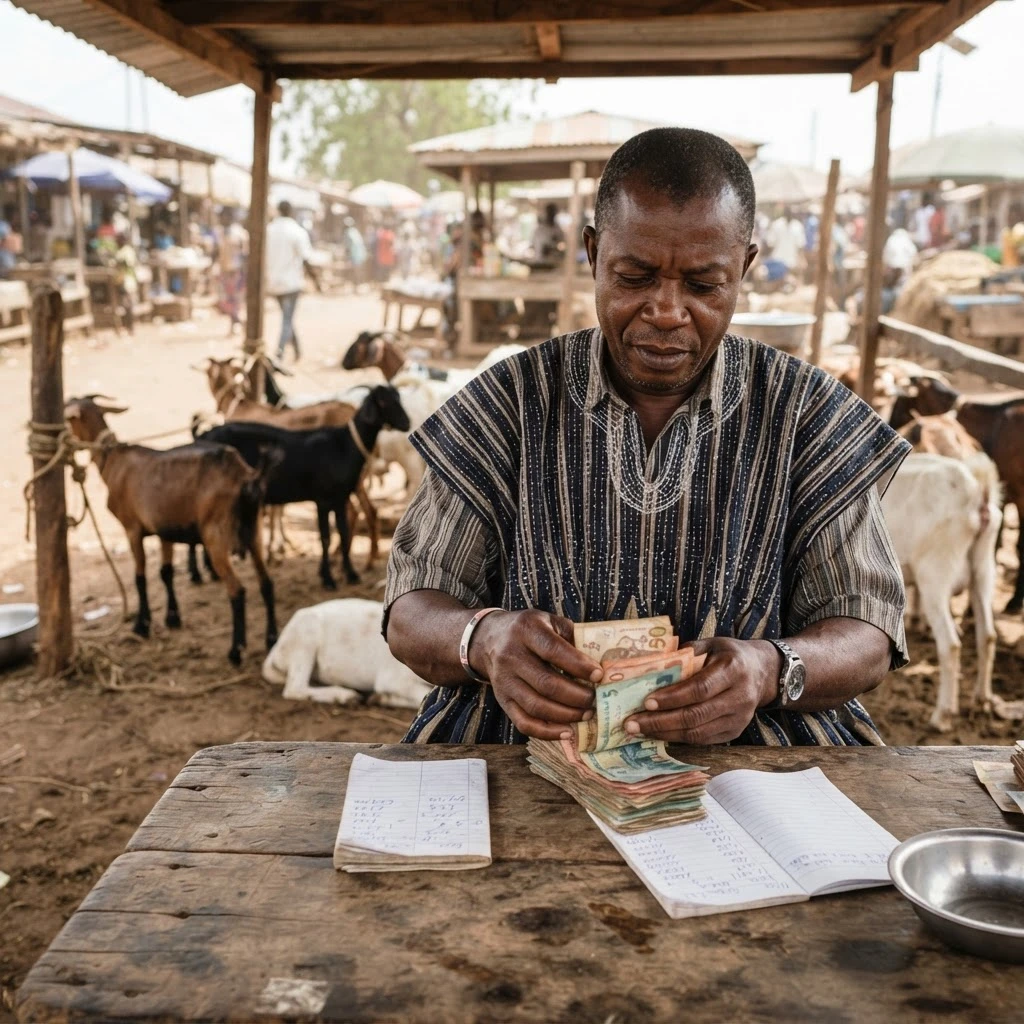
A trader recording a price in a ledger beside a hanging scale at a busy Ghanaian livestock market
Goats & Sheep · Series intelligence

Market Intelligence

Ghana projects 15.81 million small ruminants every year and measures the market they feed almost never, so every figure here is a commercial estimate rather than an official count. The country produced 65,431 tonnes of goat and sheep meat in 2024 and still could not cover its own table.
Market Intelligence · Pillar 07

A small-ruminant business starts with two questions: how big is the market it is entering, and how much power will it hold once it is inside? Ghana projects its flocks annually and measures its market barely at all, so sizing the opportunity here means naming a benchmark for what it is, a commercial estimate rather than an official return.

What follows the sizing is the five competitive forces a small-ruminant business meets, and for most entrants they favour every point in the chain except the one where the entrant is standing. Read the two halves together: a market this size, entered on these terms, rewards the operator who can prove what a plan merely assumes.

A Ghanaian livestock trader recording a goat's price and weight in a ledger beside a wooden pen at a busy market, dust and morning light, other traders negotiating in the background, documentary photograph
A benchmark, not a count
The base fact: Ghana models its flock and measures its market barely at all.
15.81M
small ruminants kept in Ghana, 2024, a projection, not a count
65,431 t
goat and sheep meat produced in Ghana, 2024
43%
national meat self-sufficiency, all meat, 2024, an all-meat rate, not a small-ruminant one

🐐 Sizing the opportunity 🐐

How big is the prize? Ghana keeps about 15.81 million small ruminants in 20241, and its own flocks yield 37,112 tonnes of goat meat in 2024 and 28,319 tonnes of sheep meat in 2024, so about 65,431 tonnes of goat and sheep meat in 2024. Both figures are projections, not counts: the meat tonnage is the flock multiplied by a fixed off-take and a fixed carcass weight, a 30 percent off-take rate and a carcass weight of 13 kg for goats and 15 kg for sheep, unchanged for a decade. FAOSTAT’s near-identical series is the same MoFA numbers carried forward, so it is not a second opinion. Use them for order of magnitude, not for a revenue line.

The nearest verified benchmark is commercial rather than official: a market-research vendor puts Ghana at about 35 thousand tonnes of goat meat, roughly 7.4 percent of West Africa’s 471 thousand tonnes2, from a paywalled preview, and it covers goat meat only. Above all of that sits a national meat-import bill of about US$375 million a year for all meat3, roughly double what MoFA’s own tables imply for the same year, so read it as an order of magnitude.

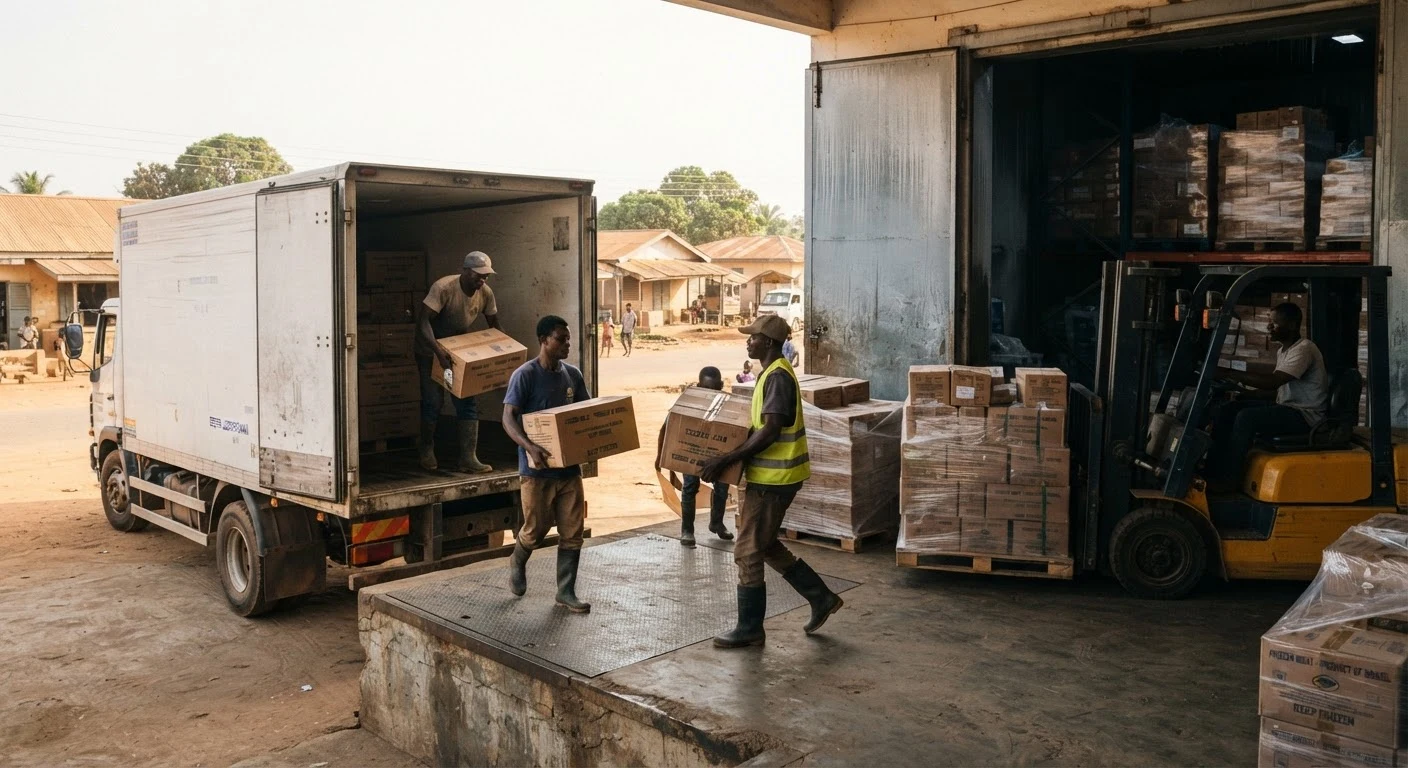
Workers unloading cartons of frozen imported meat from a refrigerated truck into a Ghanaian cold-store warehouse, stacked pallets and a forklift nearby, documentary photograph
Mostly a poultry story
95% of frozen tonnage is poultry: the small-ruminant leg is 1%.
US$375M
national meat-import bill a year, all meat, read as an order of magnitude
1%
of frozen meat imports is sheep and goat meat; poultry is about 95%

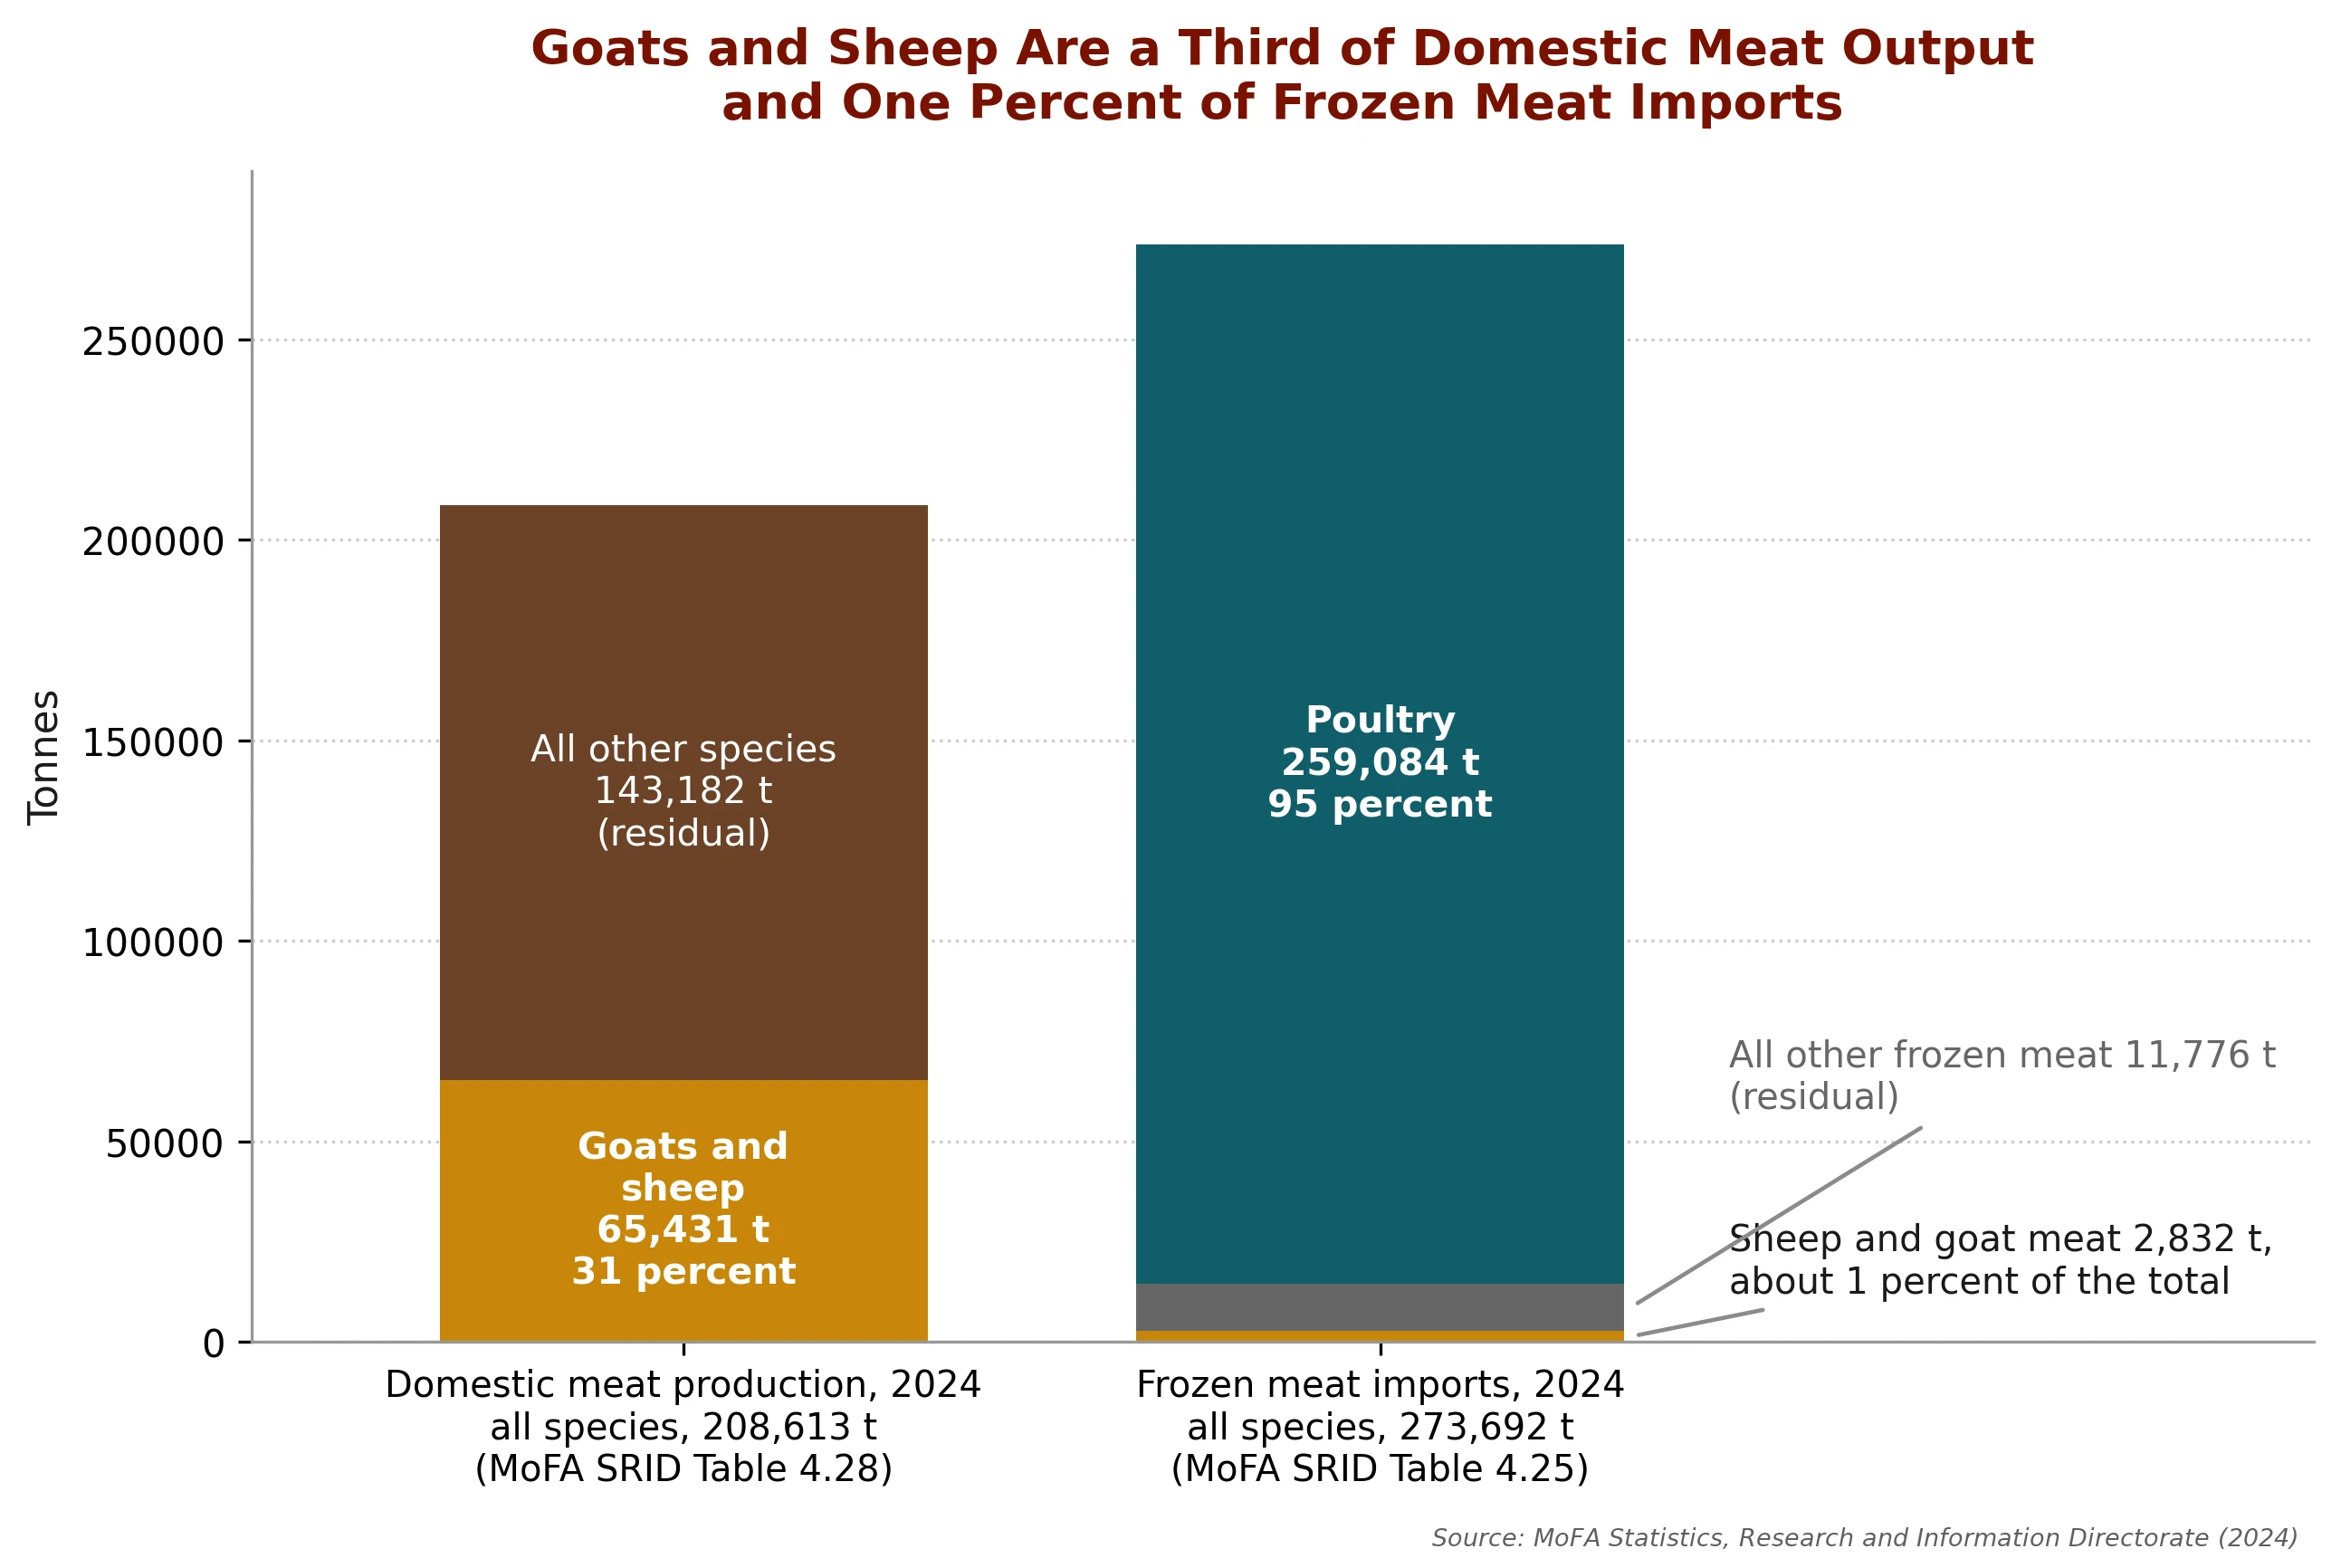
Underneath the import bill sits 273,692 tonnes of frozen meat, of which poultry is 259,084 tonnes or about 95 percent, and within that the small-ruminant leg alone is 2,832 tonnes of sheep and goat meat, about 1 percent of frozen meat imports. National self-sufficiency across all meat, which MoFA publishes as a share of domestic meat production in its own appendix, stands at about 43 percent of total meat available in 2024, and about 39 percent in 2023, and it is an all-meat rate, not a small-ruminant one. The realistic near-term prize is not that frozen-meat gap, which is mostly a poultry story, but the live-animal Sahel dependence Pillar 2 sets out and the 2026 export bans put in question. The exposure is structural and real, but by mid-2026 it had not bitten evenly: Accra traders blamed the border for rising ram prices while Kumasi abattoir intake rose from about 3,000 head to more than 5,000 and ram prices fell4. Price your own market. There is no continuous live-animal price series to plan against.

Table 15: Sizing the Goats and Sheep Opportunity
MeasureEstimateBasis
Small ruminants keptabout 15.81 million (2024)MoFA SRID (2024)
Goat and sheep meat producedabout 65,431 tonnes (2024)MoFA SRID (2024)
Goat meat market (commercial estimate)about 35 thousand tonnes, goat meat onlyIndexBox (2026), paywalled vendor preview
National meat-import bill, all meatabout US$375 million a yearPoultry News Africa (2025); read as an order of magnitude
National meat self-sufficiency, all meatabout 43 percent (2024)MoFA SRID (2024), Appendix 28
Festival ram price, Accra (2026)about GH¢5,000 to 5,500Graphic Online (2026)

Sources: Statistics, Research and Information Directorate, MoFA (2024); IndexBox (2026); Poultry News Africa (2025); Graphic Online (2026).

Domestic meat output and frozen meat imports, both decomposed, on one axis
Figure 13 Domestic meat output and frozen meat imports, both decomposed, on one axis
What this shows

This replaces v1’s import-gap figure, which argued that goats and sheep sit inside Ghana’s meat import gap. Read the two bars together and that argument collapses: the small-ruminant slice is 31 percent of domestic output and 1 percent of frozen imports, because 95 percent of the frozen tonnage is poultry. Imports minus production equals opportunity is therefore arithmetic performed on a poultry statistic. The real small-ruminant import exposure is live animals from the Sahel, and it is not on this chart.

🐐 Porter’s five forces 🐐

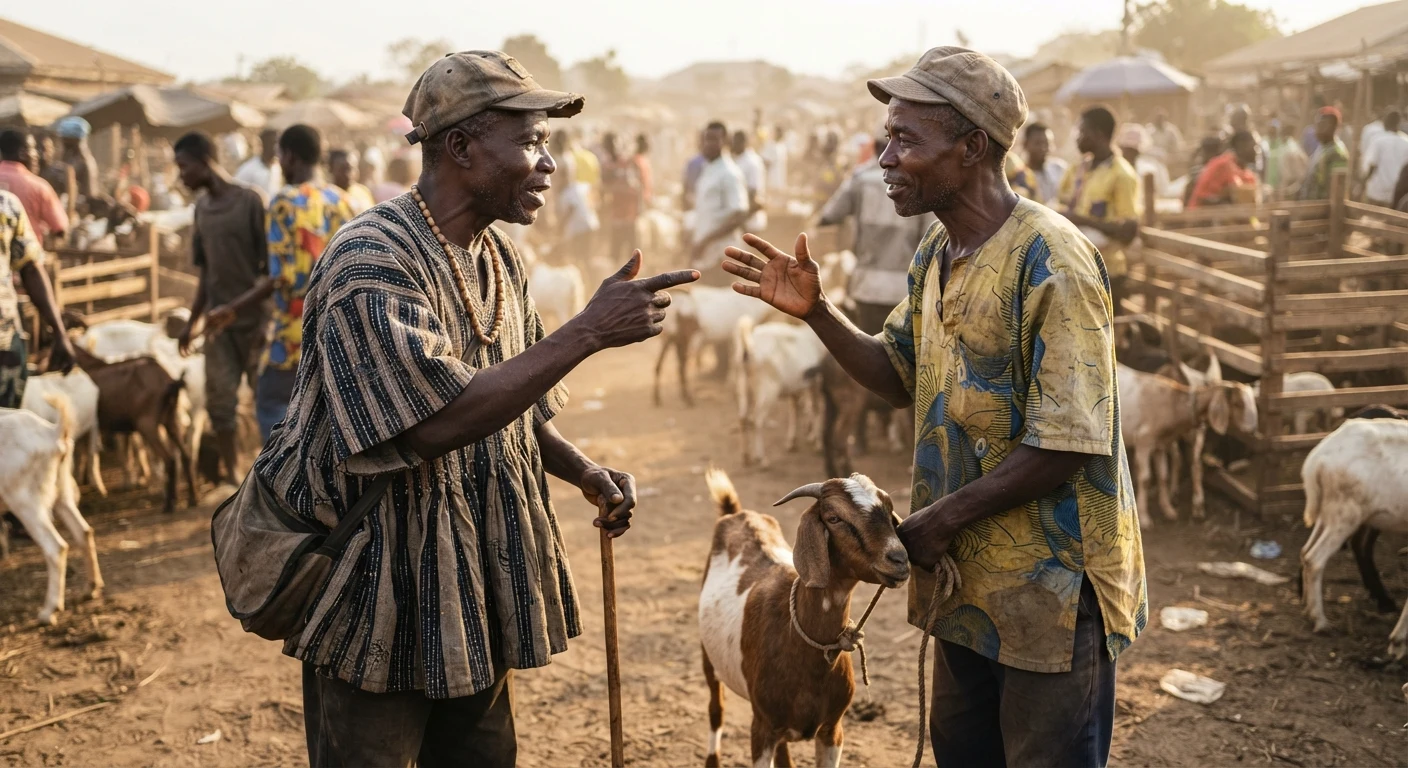
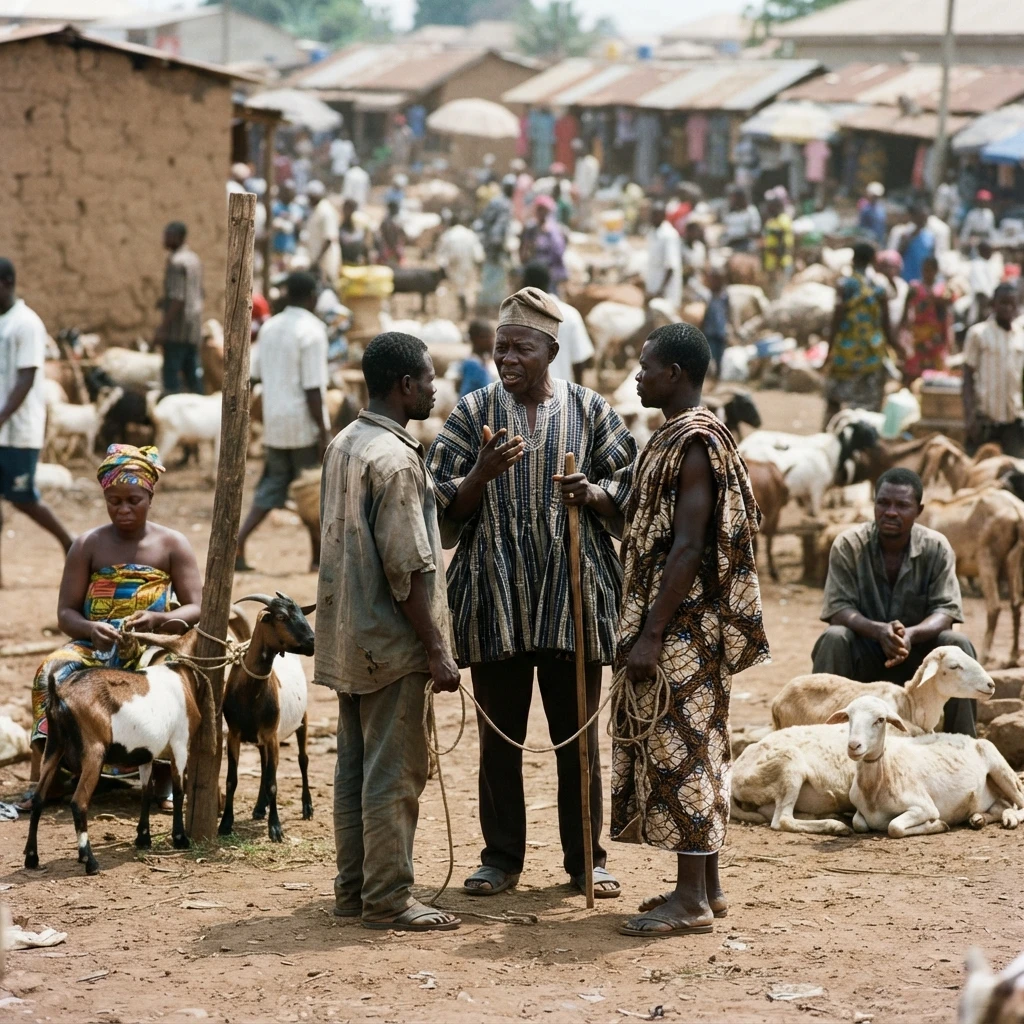
Two Ghanaian livestock traders negotiating over a goat at a crowded market, hands gesturing mid-bargain, tethered animals and dust in the afternoon light, documentary photograph
Many buyers, one concentrated layer
The buyer at the farm gate: a trading layer, not a crowd of festival shoppers.

Structure matters as much as size. The table below restates the five competitive forces on a small-ruminant business much as v1 assessed them; the pillars gathered since sharpen the evidence behind the ratings, not the ratings themselves.

Low to med.
supplier and buyer power: inputs are thin, but breeding stock multiplies and demand outruns supply
High
threat of new entrants at production; low upstream in aggregation and processing
Table 16: Five Forces on a Ghanaian Small-Ruminant Business
ForceStrengthWhy
Supplier power (stock, feed, vaccines)Low to mediumInputs are thin in rural areas, but breeding stock multiplies and is widely available
Buyer powerLow to mediumFestival and khebab demand outruns supply; buyers are many and fragmented
Threat of substitutesMediumChicken and beef compete, but chevon and mutton hold a cultural and festival niche
Threat of new entrantsHigh at production, low upstreamEasy to start a backyard flock; hard to enter aggregation and processing at scale
RivalryMediumMany small keepers and traders; the trader networks are organised and control the markets

Sources: Synthesis of Pillars 1 to 6; Clottey et al. (2007); Kassoh et al. (2021).

Two ratings need qualifying. Supplier power on breeding stock reads Low to medium because an established flock breeds fast, not because a verified commercial multiplier of improved stock exists to buy from; Pillar 1 shows the state’s own restocking programme had to import its own foundation animals. Buyer power reads Low to medium at the level of festival and khebab demand, which is genuinely large and fragmented, but the buyer you actually meet at the farm gate is the concentrated trading layer of Pillar 6, not that crowd.

What this means. Production is the force a new entrant meets on the easiest terms and profits from the least: entry is nearly free, but the buyer at the farm gate is the concentrated trading layer Pillar 6 maps, not a crowd of festival consumers.

🐐 Openings: where the measurement gap pays 🐐
01

A price series, because there is none. No market in Ghana publishes a continuous price record for a live goat or sheep. Whoever collects prices from a handful of named markets weekly and publishes them consistently owns the reference every other business in this book currently has to guess at, and the collection cost is a phone and a routine.

02

Sell the data to the lender, not only to the farmer. Pillar 5 shows every business plan in this sector guessing its revenue line. A verified price and weight series is worth more to a bank underwriting a fattening loan than it is to the fattener, and the bank can pay for it.

03

Market intelligence as a subscription. Traders already move on information asymmetry, and the operators with the worst information are the smallest ones. A cheap, honest weekly read on where animals are cheap and where they are dear has an obvious buyer.

04

The digital and AI angle. The AI opening in this pillar is forecasting, and it is blocked by the same gap. A festival-window price forecast is a genuinely useful product and a technically ordinary one, but it needs a price history that does not exist. That makes the sequence explicit rather than fashionable: collect the series first and forecast second. Esoko already proves the delivery rail works in Ghana; what it has never carried is livestock prices.

🐐 The risks that sit inside the market-sizing decision 🐐

A Ghanaian livestock trader counting cedi banknotes beside a pen of goats and sheep at a busy market, documentary photograph

Price and exchange-rate volatility

MEDIUM TO HIGH
What it is

Prices swing hard with the season and with the cedi, because many of the animals in this trade crossed a border to get here, and there is no continuous price series to forecast from.

Evidence

In the same May 2026 fortnight, Accra rams ran at about GH¢5,000 to 5,500, up from about GH¢4,000 the year before, while Kumasi rams sold from about GH¢1,500, down from about GH¢2,500 in the same window a year earlier5. Pillar 2 carries the full three-market picture and what moved each one.

Who it hits

Fatteners and traders hardest, because they buy at one price and sell weeks later, and anyone whose stock was bought with borrowed money.

How to manage it, and the opening

Buy in the lean season and sell into the festival peak rather than the reverse, track the cedi weekly since it sets the landed cost of every imported animal, and keep a written price record from the first month of trading, the only forecasting instrument this market currently offers.

A well-known livestock trader surrounded by a crowd of sellers at a busy Ghanaian market, directing several transactions at once, documentary photograph
🐐 Key takeaways 🐐
01

Ghana projects about 15.81 million small ruminants and derives about 65,431 tonnes of meat from that projection, using a fixed 30 percent off-take and fixed carcass weights. Both are model outputs, not counts, and FAOSTAT's near-identical figure is the same series carried forward rather than an independent check.

02

The nearest verified market benchmark is a commercial vendor estimate covering goat meat alone, so treat any single national market-size figure for this sector with suspicion.

03

The national meat-import bill is mostly a poultry story, not a small-ruminant one: frozen sheep and goat meat is about 1 percent of frozen meat imports. The real small-ruminant exposure is the live-animal Sahel trade Pillar 2 sets out.

04

No continuous price series exists for Ghanaian goats and sheep, so a revenue line in a business plan here is an estimate built on production, not on an observed market.

05

The five competitive forces favour a new entrant least at the point of production: entry is nearly free, but the buyer is a concentrated trading layer, not a crowd of festival consumers.

Written for each reader

🐐 Practitioner intelligence 🐐

Hover any card to pause and lift it.

For students

Read this pillar as a lesson in provenance as much as in numbers. A national production count and a commercial market estimate answer different questions, and v1's own retired market-size figure is a case study in why a plan should be able to open every source it quotes. Practise tracing one figure in this pillar back to its named table before trusting the next one.

For entrepreneurs

Do not build a revenue projection on a market-size figure you cannot trace to a source; the ones that circulated for this sector could not be, and both sat below Ghana's own production count. Cost a plan from the production and trade tables here, price festival stock from Pillar 2's own market visits, and expect to be a price-taker at the farm gate unless you move up the chain toward aggregation or processing. Track your own buying and selling prices from day one; within a year you will hold a longer price record than any published source in this sector.

For investors

The thesis is a projected production series and almost no market measurement at all: Ghana models its flock and its meat output and measures its market barely at all, so ask which table every figure in a plan traces to and reject any that cannot be opened. Underwrite the cedi and the Sahel border status explicitly, since both moved festival prices within the last two years, and weigh a maintained buying-and-selling price record above a headline market-size number, since an operator who keeps one is already managing the risk this pillar describes.

For ecosystem actors

The public opening is a published small-ruminant price series, not another market-sizing report. A monthly index across four or five markets would serve traders, lenders and the state alike, and it is cheaper to fund than the one-off studies whose figures now circulate unchecked years after the source went behind a paywall. A useful public target is simple: the number of markets carrying a continuous, publicly available price record, which today is zero.

Where this connects.The festival price detail and the live-animal Sahel dependence this pillar only sizes are set out in Pillar 2. The trader concentration behind the farm gate’s buyer power is measured in Pillar 6, with the margin ladder that follows from it. The state support, the PESTLE and SWOT reading, and the entry strategies this pillar’s competitive structure implies are carried in Pillar 8.

Footnotes
  1. Ministry of Food and Agriculture, Statistics, Agriculture in Ghana (2024).
  2. IndexBox, Western Africa (2026).
  3. Poultry News Africa, Ghana launches $10 million livestock program to reduce meat imports (2025, 13 September), accessed 26 July 2026, https://poultrynews.africa/2025/09/13/ghana-launches-10-million-livestock-program-to-reduce-meat-imports-2/.
  4. Graphic Online, Eid-ul-Adha 2026 (2026).
  5. Graphic Online, Eid-ul-Adha 2026 (2026).
Download full PDF
UpcomingThis document isn't available yet.