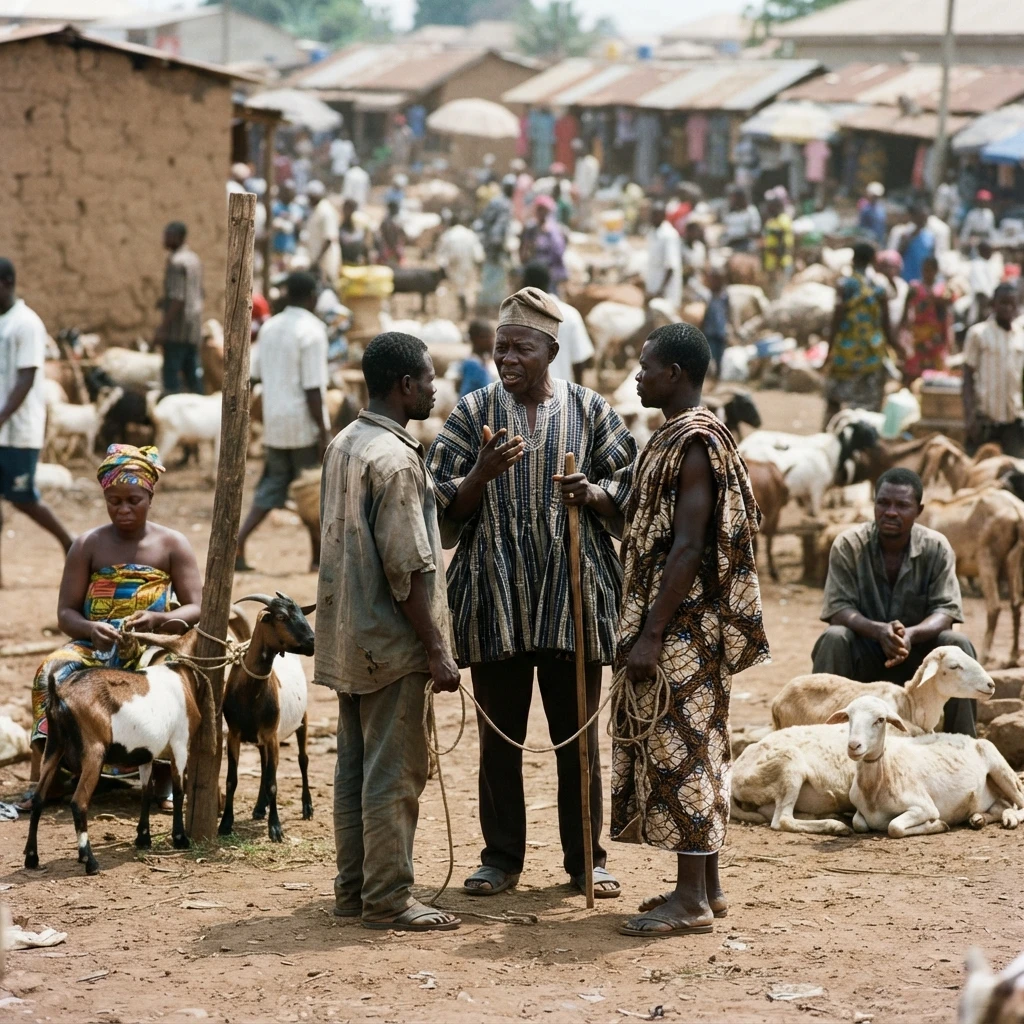
A trader and a butcher exchanging cash over a small ruminant at a Ghanaian livestock marketUpload photo · /images/goat-pillar-hero-5.webp
Goats & Sheep · Pillar 06
Value Chain Analysis
Three to five hands stand between keeper and eater, and little value is added along the way because inspected slaughter, chilled meat and skin collection are small or informal, with only about 4 percent of MoFA's estimated off-take passing inspected slaughter.
Value chain analysis · Pillar 06
Ghana’s small ruminant chain is unusually short and unusually crowded at one end. Little value is added between the keeper and the eater, because the links that add it in other countries, inspected slaughter, chilled and portioned meat and skin collection, are small or informal here. The eight links are mapped below with the margin evidence for each.
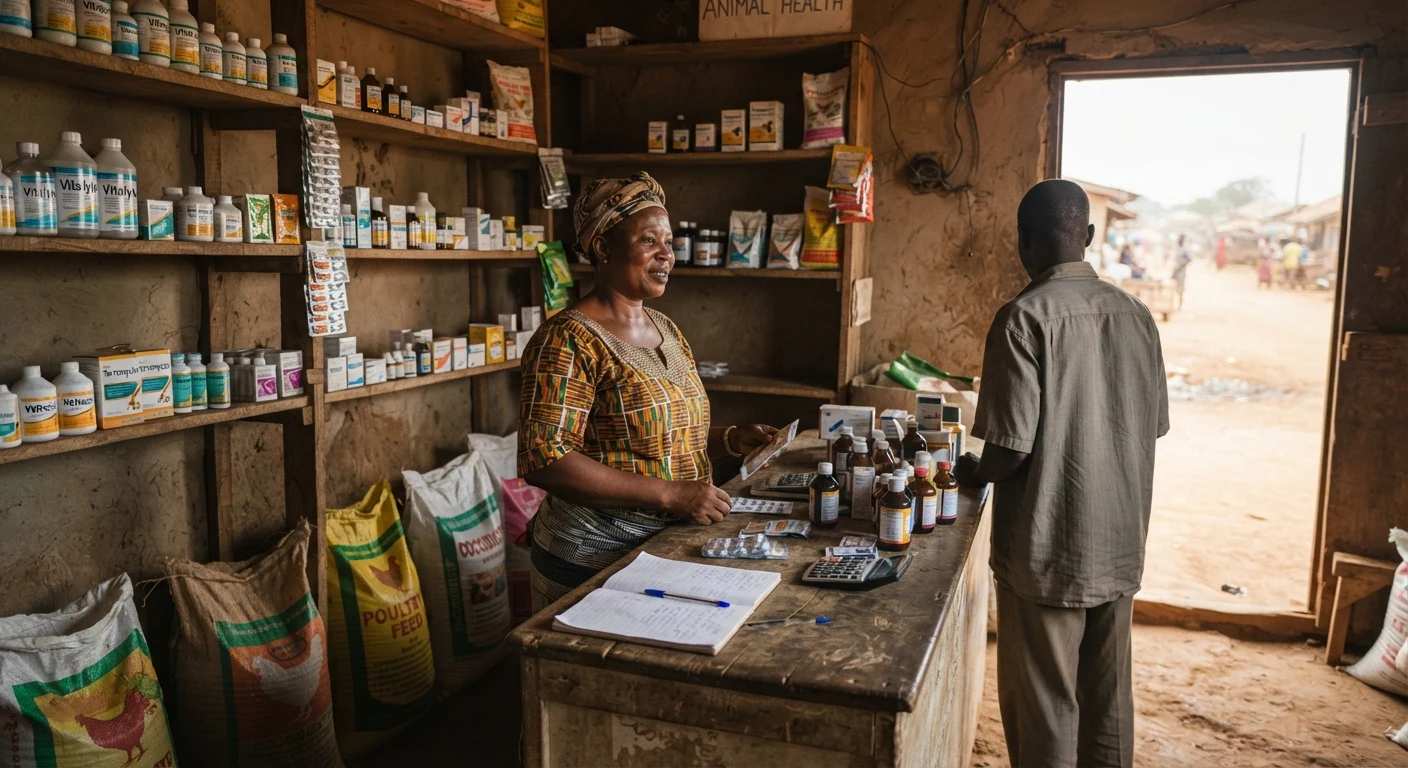
A rural Ghanaian agrovet dealer's small shop with sparse shelves of veterinary drugs and feed sacks, a keeper standing at the counter, documentary photographUpload photo · /images/goat-vc-inputdealer.webp
Trading margin best measured
The chain in brief: little is done to the animal between farm and plate, so most of the margin is earned on movement, storage and risk.
8
links in the chain, seven in the main flow and one by-product branch
24.85%
net marketing margin on goats, from the best-measured link in the chain
~4%
of MoFA's estimated small ruminant off-take passes inspected slaughter
🐐 The chain in outline, and what has been measured 🐐
The chain that carries a Ghanaian goat or sheep from a compound in the Northern Region to a khebab grill in Accra is about three to five stages between producer and consumer, without significant value addition, and most animals reach the eater with little done to them beyond moving, slaughtering and cooking, so most of the margin is earned on movement, storage and risk. Each opening below adds one useful link to the chain.1
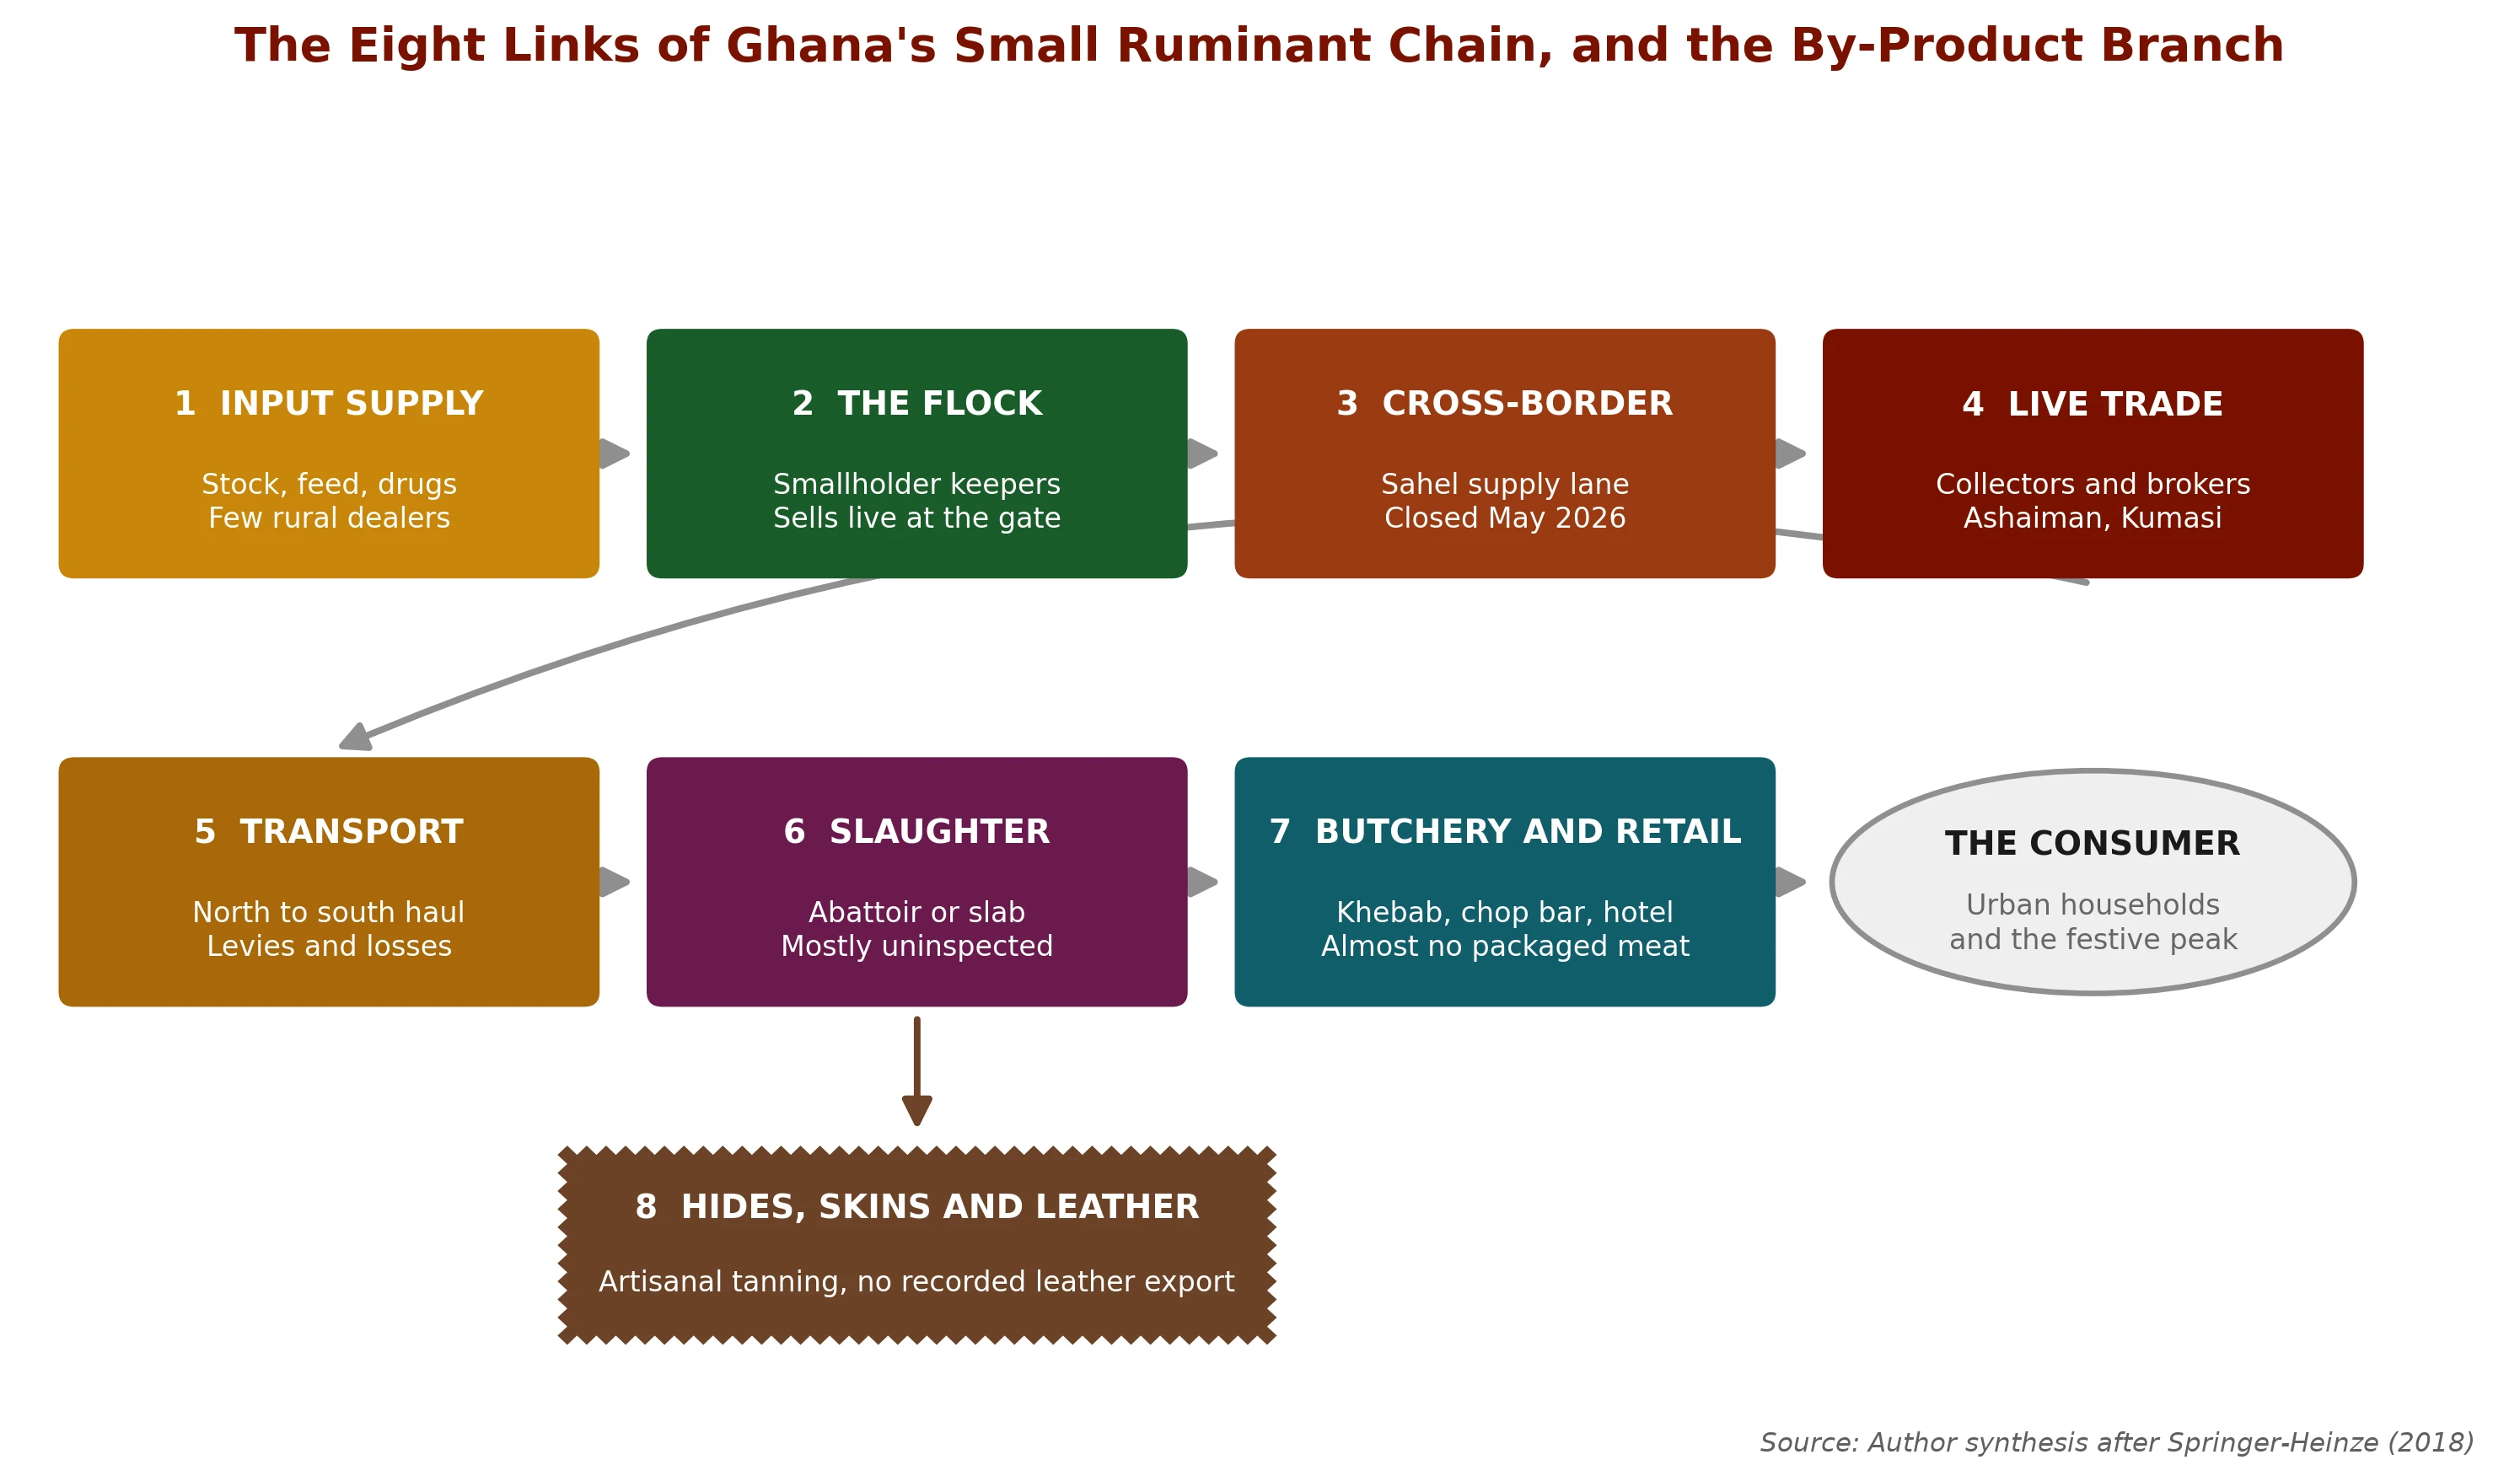
The map below follows Springer-Heinze (2018), drawing a stage only where it marks a distinct business model, which is why Ghana’s chain is mapped as eight links, seven in the main flow and one branch, each run by a different kind of business. The trading link has the fullest margin data, from a 2015 survey of 284 traders. Retail prices exist for the consumer end, from MoFA’s monthly mutton retail series and from Accra butchers’ 2026 price lists, but no study yet splits the consumer price between butcher and retailer.234
Figure 7 The eight links of Ghana’s small ruminant chain, and the by-product branch that drops out of slaughter
What this shows
Count the boxes that move the animal against the boxes that change it. Links 2 to 5 keep, move or resell a live animal in the same form it left the farm. The links that transform it, slaughter and the by-product branch, are the most informal, and the branch is drawn separately because it drops out of slaughter rather than following the main flow. The gap between link 6 and link 7 is where another country’s processing layer would sit.
Table 10The eight links, what each earns, where each leaks, and what sits inside the leak
Table 10: The eight links, what each earns, where each leaks, and what sits inside the leak
Link
Who operates it
The margin or price signal
Where value leaks or the link breaks
The opening inside the break
1. Input supply and breeding
A thin scatter of agrovet dealers, vaccinators and neighbours selling stock
Veterinary, medication and feed together are about 1.5 percent of a trader's batch cost
Few commercial multipliers of improved stock; drugs reach keepers mainly through informal vendors and drug stores, while professional veterinary care is costly and thin567
Sell the input and the record together: health-verified stock with a written history
2. Production, the flock
About 15.81 million animals, in flocks of about 8 head in the south and 16 to 20 head in the north
Farm-gate price; the animal is 85 percent of what the next actor spends
The seller has no volume, no storage and no price information, so sells on need
Aggregate, or sell finished rather than early. Both move the sale off the gate
3. Cross-border sourcing
Burkinabe, Malian and Beninese trader networks running the Sahel to Kumasi corridor
Import volumes and the festive price; Burkina Faso supplied about 97 percent of recorded live imports by head in 2023, 88 percent in 2024 and about half in 2025, when Togo supplied about 43 percent8
The upstream link sits in another country; Burkina Faso suspended exports from 8 May 2026, yet Kumasi Abattoir received more animals before Eid 2026 than in 202598
Substitute the lane domestically, as a supply play
4. Aggregation and the live trade
Long-distance traders, collectors and market brokers, 95 percent of them men
Net marketing margin of about 24.85 percent on goats and 17.73 percent on sheep
Concentration. A few very large traders and a broker layer set the terms of entry
Countervailing volume: a producer group that can fill a truck negotiates differently
5. Transport and logistics
Independent hauliers, mostly moving cattle with small ruminants on upper decks
Transport is 7.20 percent of batch cost and unofficial payments a further 1.13 percent
Loss and injury in transit, unmeasured for small ruminants, plus levies at checkpoints
Dedicated small ruminant haulage with a loading ramp and a recorded loss rate
6. Slaughter
A few public abattoirs in the main cities, with new facilities opened in Tamale in December 2025 and due in Accra in September 2026, and a large informal slab trade1011
Slaughter fee and offal value; inspected slaughter is about 4 percent of MoFA's estimated off-take
Breeding females killed pregnant, and hygiene that cannot be verified outside inspection
Hygienic slaughter sold as certified supply to buyers who require it
7. Butchery, retail and the consumer
Butchers, khebab grills, chop bars, hotels and festive buyers
Retail price: about GH¢130 a kilogram for goat meat from Accra processors in September 2026, with no study splitting it between butcher and retailer342
Packaged, chilled goat meat is sold by only a few Accra processors, so most meat sells warm and unbranded312
Portioned chilled chevon and mutton with a cold chain behind it
8. Hides, skins and leather
Artisanal tanners and leather vendors, concentrated in the north
Recorded goatskin output nearly doubled to 2014 while export value halved to 2006; raw goatskins lost their own customs code in 2007, and Ghana’s exports of raw skins under the shared code were about 515 tonnes in 2025, mostly to China138
Many skins are singed and eaten with the meat and the rest are discarded or sold raw; recorded sheep and goat leather exports were a few kilograms in 2022 and 2023 and none in 2025148
Collection and preservation, which is the neglected step, before tanning
Sources: Kassoh et al. (2021) for the trader cost and margin figures, from 284 traders in Kumasi and Tamale on 2015 fieldwork; Statistics, Research and Information Directorate, MoFA (2024) for the population and the inspected slaughter count; Valerio (2024) for the trader network structure, measured across West Africa rather than in Ghana alone; Masciana (2015) and UN Comtrade (2026) for the skins and leather series and the import shares; Nuvey et al. (2023) for the input-supply gap. Chain structure after Springer-Heinze (2018).
What this means.Most links in this chain move the animal, and the links that add value, inspected slaughter, chilled and portioned meat and skin collection, are small or informal. The best margin evidence is for the trading link. No Ghanaian study has yet measured a processing margin for goat or sheep meat, although a few Accra processors sell portioned goat meat at about GH¢130 a kilogram.34
🐐 Link 1 and Link 2: the gap at the top of the chain, and why the farm-gate seller captures least 🐐
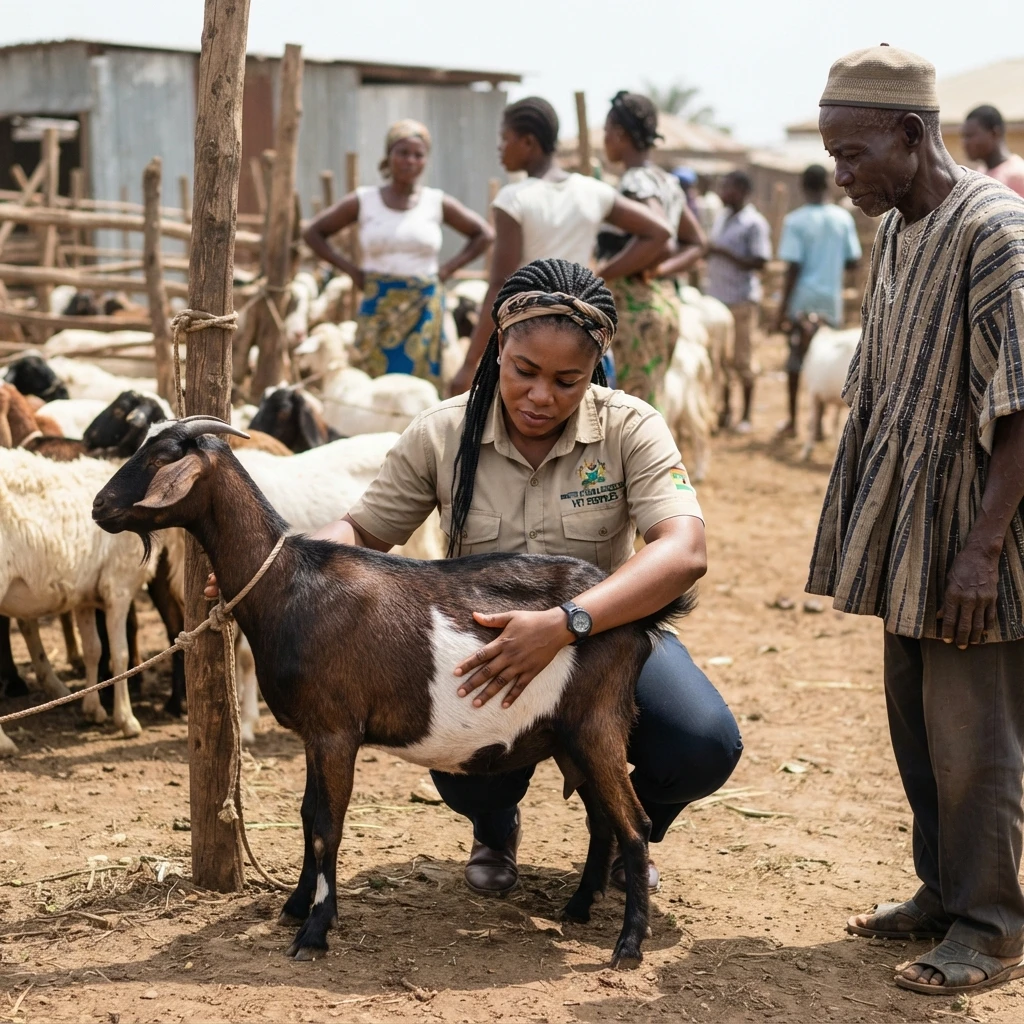
The chain starts with a weak link. Keepers buy most medicines themselves, from veterinary drug stores, human drug stores, livestock markets and roaming vendors; informal providers score best on drug availability and professional veterinary officers best on efficacy but worst on cost, and only about one keeper in five vaccinates5.
Inside a trader’s batch the entire animal-health and feed spend is close to invisible: veterinary inspection runs at GH¢45.78 a batch (0.82 percent of cost), feeding at GH¢27.33 (0.49 percent) and medication at GH¢8.36 (0.15 percent), against about 85 percent for the animals themselves, so together they come to under one and a half percent of what a thirty-five-animal batch costs a trader1. This is the trader’s spending on animals in transit, so it says little about demand for inputs on the farm, where keepers buy medicines in single doses.1
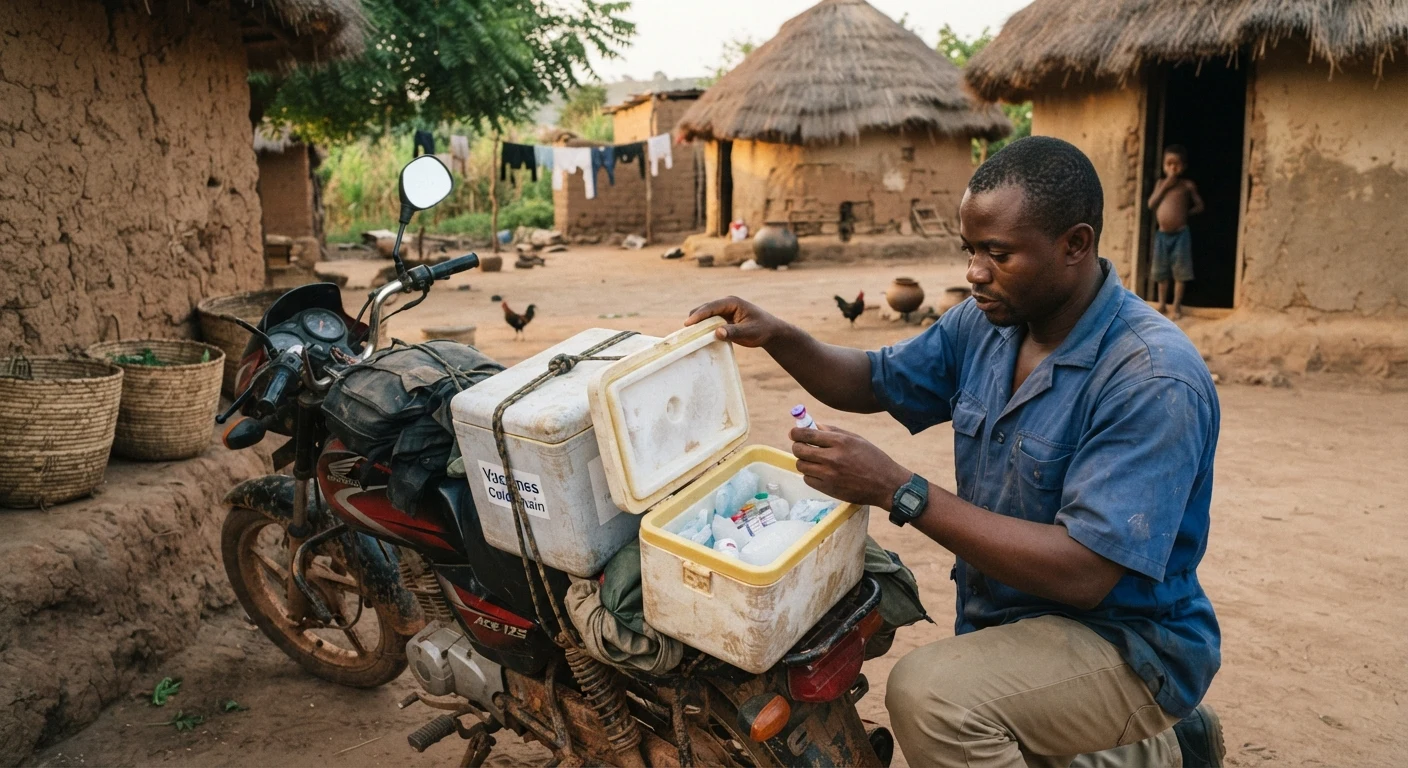
A community animal health worker unpacking a small cold box of vaccine vials from a motorcycle beside a rural Ghanaian compound, no shop or fixed premises visible, documentary photographUpload photo · /images/goat-vc-inputdealer2.webp
Under 1.5% of batch cost
Health and feed spend is close to invisible inside a trader’s batch.
0.82%
of batch cost is veterinary inspection
US$3.27
per livestock unit, Cowtribe's subscription vaccine price on 2019 pricing
The gap has a commercial fix, because the input that sells is the input bundled with the service that makes it worth buying. Cowtribe, a subscription vaccine delivery service founded in Tamale in 2016, prices its offer from about US$3.27 per livestock unit, where one unit is one cow or ten goats or fifty chickens, on 2019 pricing. What a keeper pays for is a scheduled visit with the vaccine included.15
The breeding half of this link is treated in full in Pillar 1; the value-chain point here is narrower. A chain in which almost no operator sells a health-verified, performance-recorded animal gives quality little way to command a price, so this link decides whether any of the others can differentiate. The opening, an input and service bundle, is ranked below.
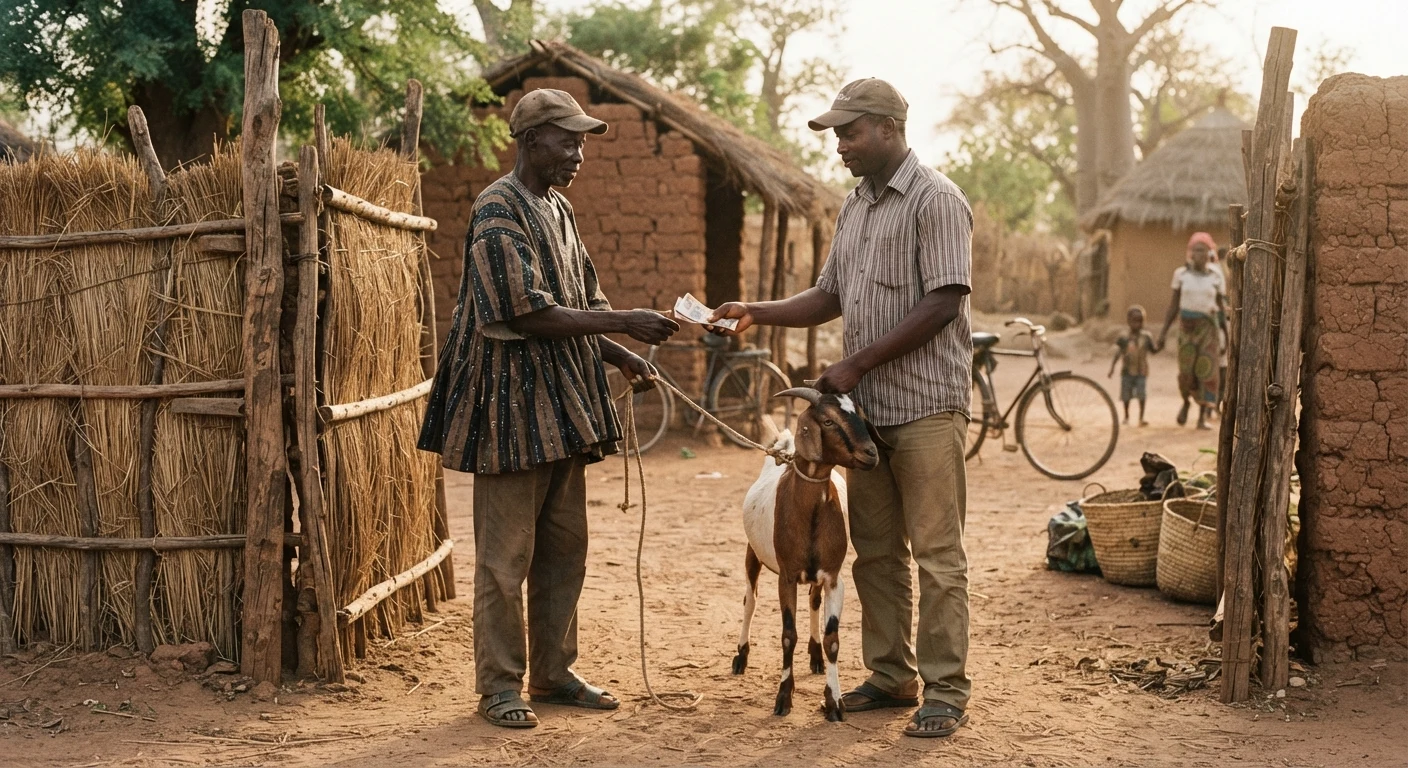
A smallholder keeper handing over a single goat to a livestock trader at a rural compound gate in northern Ghana, cash changing hands, documentary photographUpload photo · /images/goat-vc-farmgate.webp
The widest trading margin
The small goat sold off the gate carries the widest percentage margin in the trading link.
7.9 head
average goat flock size in the middle belt and south
41.77%
trader margin on small goats sold off the farm gate
Link 2. The flock
The producer sells live, at the gate or the nearest market, into a transaction whose terms are set by the buyer, for three reasons, any one of which would be enough on its own. The first is scale: a goat flock in Ghana averages about 7.9 head in middle-belt and southern Ghana16, while a trader moves about 23.5 goats and 16.6 sheep a trip, on about 36 trips a year1, so one party is disposing of an animal and the other is filling a truck. The second is timing: small ruminants in northern Ghana are held mainly as a store of wealth, and at least 60 percent of the net benefit17a keeper derives from them is non-cash, so an asset held for insurance is sold when the insurance is claimed, school fees, a funeral, a hospital bill, and a seller who must sell this week is a price-taker in any market. The third is information: the keeper does not know what the animal will fetch at the destination market, and the trader does, because visiting markets is the trader’s occupation.
The result shows in the margin data, and it runs in a direction most producers do not expect: trader margins are widest on the smallest animals, at 41.77 percent on small goats, 34.01 percent on medium and 21.11 percent on large, while the sheep series shows no clear size gradient at all, at 23.12 percent on small sheep, 23.36 percent on medium and 21.80 percent on large, rising slightly from small to medium before falling on large. In percentage terms the small goat carries the widest trading margin, about twice that on a large goat. In cedis the trader’s net profit per head is similar across sizes, about GH¢47 on a small goat, GH¢54 on a medium one and GH¢44 on a large one at 2015 prices, so a producer who sells small gives up a larger share of a smaller price. Fixing any one of the three reasons above moves the price, and fixing all three, what an aggregation group does, turns the producer from accepting into negotiating; Pillar 5 prices the finishing decision, and who the producer sells to matters as much as how heavy the animal is.1
🐐 Link 3: cross-border sourcing, the part of the chain that is not in Ghana 🐐
Ghana’s small ruminant chain has an upstream link in another country. Ghana’s own 2024 return records live imports of 24,413 sheep and 30,056 goats, about 54,469 head, down roughly 10 percent on the year18, while partner-level trade data put Burkina Faso at about 97 percent of recorded live imports by head in 2023 (98 percent by weight), 88 percent in 2024 and about half in 2025 (78 percent by weight), when Togo supplied about 43 percent of the head819. UN Comtrade records about 134,000 head from Burkina Faso alone in 2024, about two and a half times the national return’s count from all partners, so the two sources agree on the direction and differ on the level.8
In the other direction Ghana absorbs about 60 percent of Burkina Faso’s livestock exports by value20, a mutual dependence that Burkina Faso interrupted when it suspended livestock exports from 8 May 2026 until further notice; Niger had done the same in March 202621. Pillar 2 owns what that did to demand and the festive price; a link outside the jurisdiction cannot be regulated, financed, inspected or contracted from Ghana, only depended upon, so dependence on it is a supply risk. In the event, Kumasi Abattoir received more than 5,000 animals by 21 May 2026, against about 3,000 in the same period of 2025, and ram prices fell, which traders put down to the stronger cedi.9
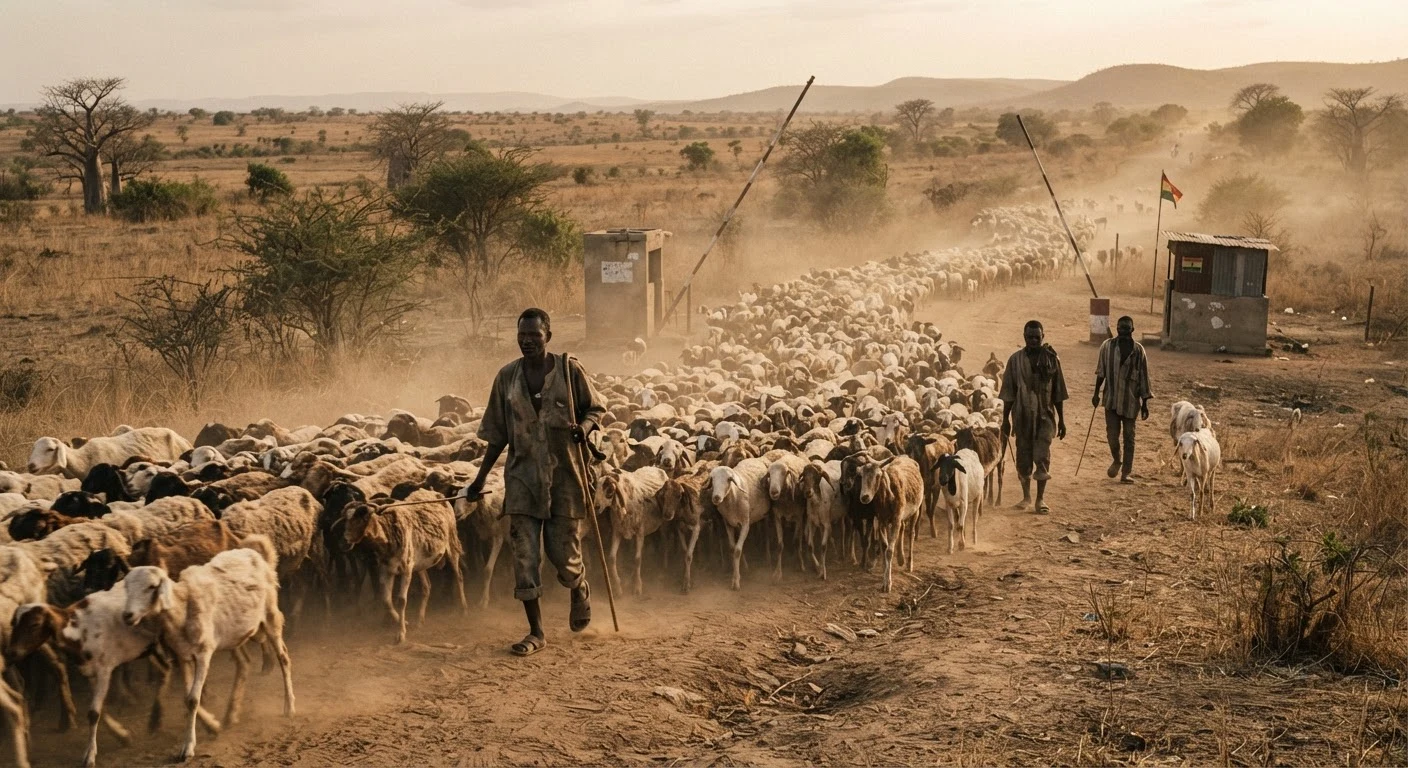
A long line of sheep and goats being trekked across a dusty Sahel border crossing into northern Ghana, herders on foot, dry savannah country, documentary photographUpload photo · /images/goat-vc-crossborder-trek.webp
Burkina: 97% (2023) to about half (2025)
Burkinabe, Malian and Beninese traders run this corridor. Ghana depends on it and cannot regulate it.
~54,469
head of sheep and goats officially imported live in 2024
8 May 2026
the date Burkina Faso suspended livestock exports
The composition of that link is more striking than its volume: the trader community whose main market is Kumasi is made up of traders from Burkina Faso, Mali and Benin rather than Ghana, moving cattle 76 percent, sheep 23 percent and goats 1 percent of the animals moved22, so it is a cattle network with a sheep tail and almost no goats, not the whole of Ghana’s trade, but it does establish that the organised, high-capital layer serving Ghana’s largest inland market is not domestically owned. One fact changes what the closure means over the medium term: Burkina Faso created a national slaughterhouse agency in April 2025 and by January 2026 had announced one at Banfora costing close to US$5 million20, so the supplier is building the processing layer Ghana does not have, and a country that chills its own animals does not need to export them live. The ban is the visible event; the abattoir programme is the durable one.
Market signal. Watch the Burkinabe slaughterhouse programme as well as the border notice. A ban can be lifted by decree and a processing plant cannot be un-built, so if the Sahel lane reopens as chilled carcass rather than live animals, the live-animal opening narrows and domestic slaughter capacity is the one that widens.
🐐 Link 4: aggregation and the domestic live trade, where the power sits 🐐
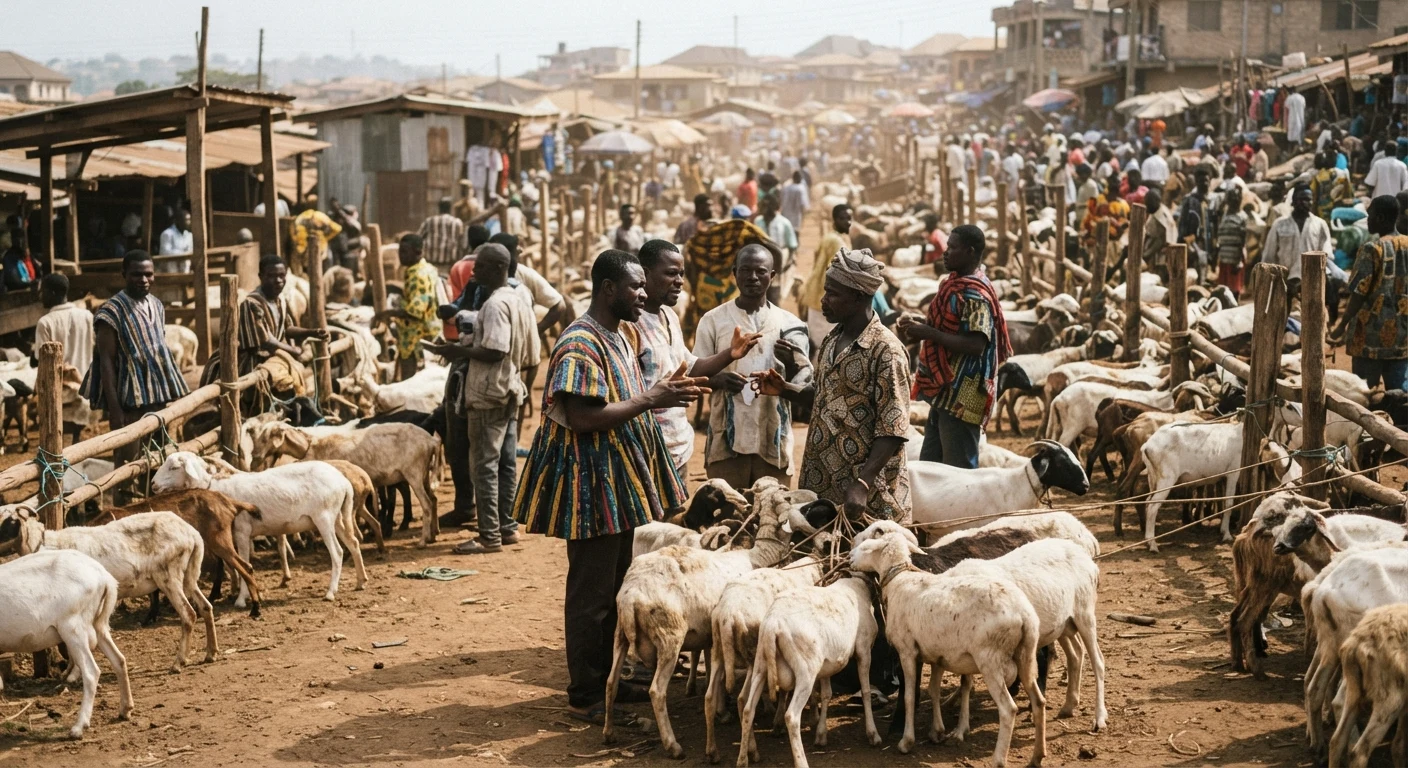
A busy Kumasi livestock market with dozens of goats and sheep tethered in rows, traders and brokers negotiating in small clusters, documentary photographUpload photo · /images/goat-vc-kumasi-market.webp
95.1% of traders surveyed are men
A settled, well-organised trade whose main barrier to entry is fifteen years of knowing who has animals to sell.
99.3%
eigenvector centralisation across West African livestock markets
16.4x
broker visits to Kumasi on average, against 1.6 for other traders
The trade is well organised. Start with who the traders are. In a 2015 survey of 284 traders in Kumasi and Tamale, 270 (95.1 percent) were men, with a mean age of about forty-two, nearly fifteen years in the trade, and three in ten with no formal education1: a settled occupation whose main barrier to entry is fifteen years of knowing which compound in which district has animals to sell this month.1
Network analysis of about 69,800 recorded livestock shipments across West African livestock markets between 2013 and 2017 finds eigenvector centralisation of 99.3 percent, meaning markets dominated by a few very large traders22, a regional figure rather than a Ghanaian statistic, but the Ghana-located rows are clear: at Kumasi, brokers visited the market 16.4 times on average against 1.6 times for non-brokers, a ratio of about ten to one that makes it one of the three markets in the region where brokers are most over-represented. That ratio explains where the power comes from: a margin of about a quarter taken once is a modest return, but the same margin taken on ten times the market presence is a different business, and the measured trader turns over about 23.5 goats and 16.6 sheep a trip, on about 36 trips a year1, roughly one trip every ten days. Power here comes from frequency, which a smallholder selling four animals a year cannot accumulate.
Springer-Heinze (2018) notes this kind of power needs no anticompetitive practice: the conditions that weaken a supplier sit on the producer side, and the manual’s remedy is differentiated demand and cooperation among producers, building regular contracting with the trader layer. The main hubs are Ashaiman Tulaku near Accra, the Aboabo, Lamashegu, Kukuo and Shishegu markets in Tamale, and the Kumasi Abattoir2324. Siting is a live dispute too: in May 2026 Parliament’s Public Accounts Committee called for the roadside market on the Kanda Highway to be shut down or relocated on sanitation grounds, MoFA directed unpermitted temporary markets to cease after Eid, and traders said the area has no designated livestock market like Ashaiman’s25, evidence that the informality here is partly a facilities gap.
Frequency over price
Relationships as capital
Information advantage
What this means. Plan to be worth transacting with. Frequency, information and relationships hold even against a better price offer from a newcomer. What changes the terms is reliable volume, documented health status and delivery on a date, which a high-frequency buyer values and cannot get from a smallholder. Aggregation is the entry point into this link, and contracting is the way out of its worst terms.
🐐 Link 5: transport and logistics, the north to south haul 🐐
The chain runs north to south. Flocks are largest in the Northern, Upper East and Upper West regions and in the North East and Savannah regions created from them in 2019, where the drier grassland suits small ruminants and they serve as the main store of household wealth, while the biggest consuming markets are the southern cities, above all at the festivals, so animals are trekked and trucked south to the Ashaiman, Kumasi and Accra markets and topped up by live imports entering through the north. That north to south flow, plus the cross-border leg above it, is the physical shape of the chain and the reason transport, aggregation and the border position drive the price a producer sees.26
Inside a trader’s accounts, this link is the largest single cost after the animal itself: transport runs at 7.20 percent of batch cost, the trade pays 1.66 percent of batch cost to brokers, and unofficial payments in transit take a further 1.13 percent. The unofficial payment is small, but it appears as a routine cost in a published trader budget, a toll priced into every animal that moves south.1
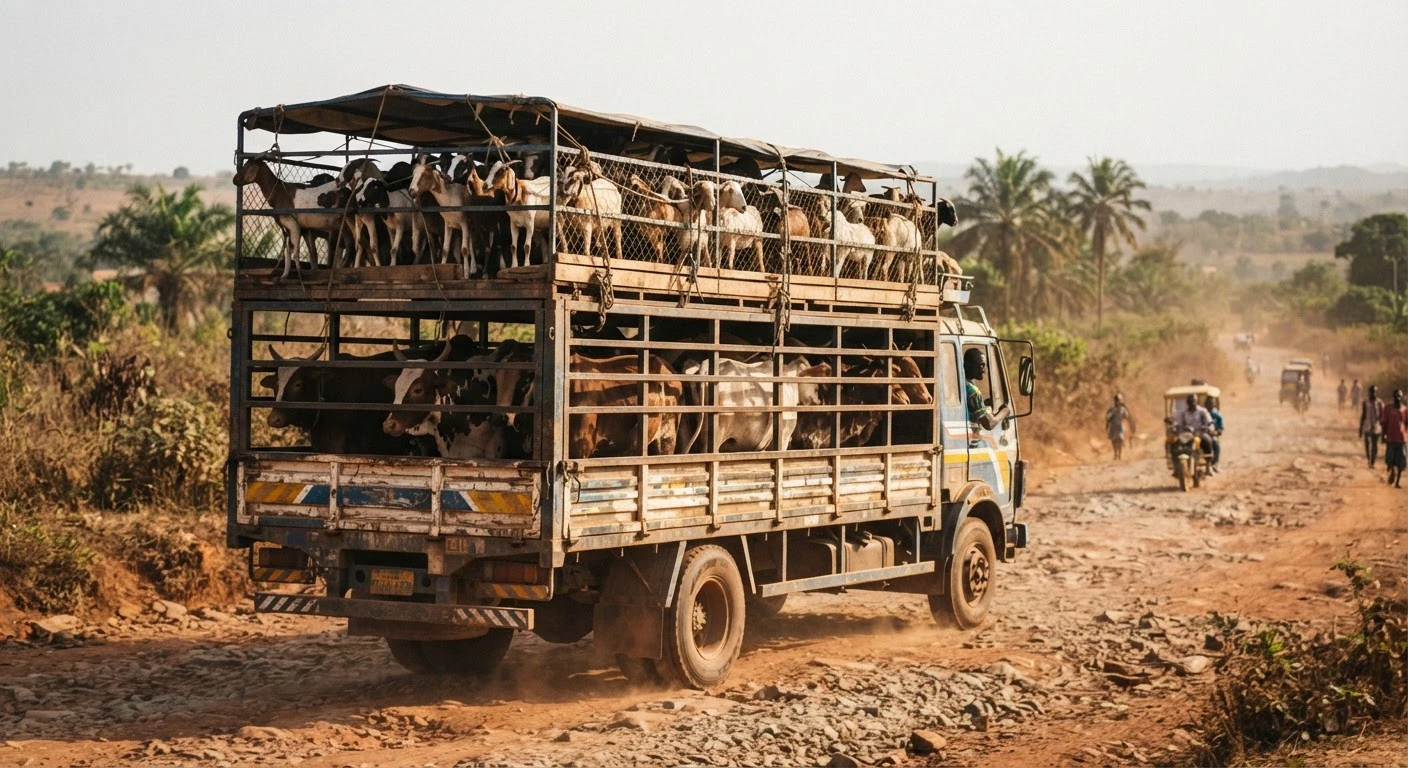
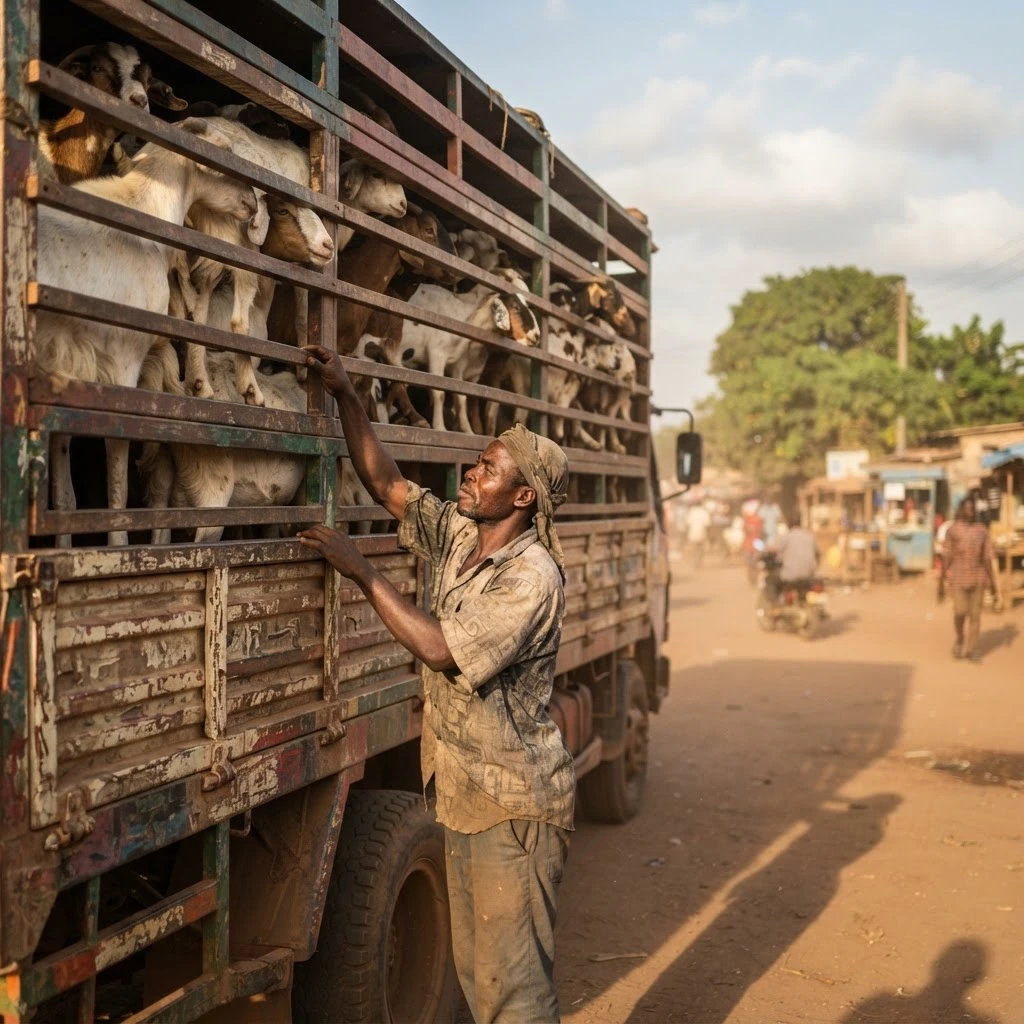
Goats and sheep riding on a makeshift upper deck above cattle on a livestock transport truck heading south on a rough Ghanaian highway, documentary photographUpload photo · /images/goat-vc-transport-truck.webp
Small ruminants ride on top
Small ruminants travel above the cattle to stop them being trampled.
7.20%
of batch cost is transport, the largest cost after the animal
528 km / 18 hrs
the average Burkina Faso border to Accra haul, cattle data
The physical conditions of the haul are documented only for cattle, and the distinction matters: a 2024 survey of seventy-eight cattle transporters on the route from the Burkina Faso border to Accra, 28 percent of whom also carried sheep and goats, found journeys averaging 528 kilometres and eighteen hours, well under half the vehicles judged fit for the task, and small ruminants riding makeshift upper decks above the cattle to stop them being trampled where the two travel together.27
There is no loss rate for small-ruminant transport in Ghana. The 15.4 percent average transport mortality in a 2024 Ghana survey is for cattle. Weigh and count a sample at loading and at arrival across twenty journeys and you will have a baseline to prove savings against.
🐐 Link 6: slaughter, the four percent that is inspected, and what happens to the rest 🐐
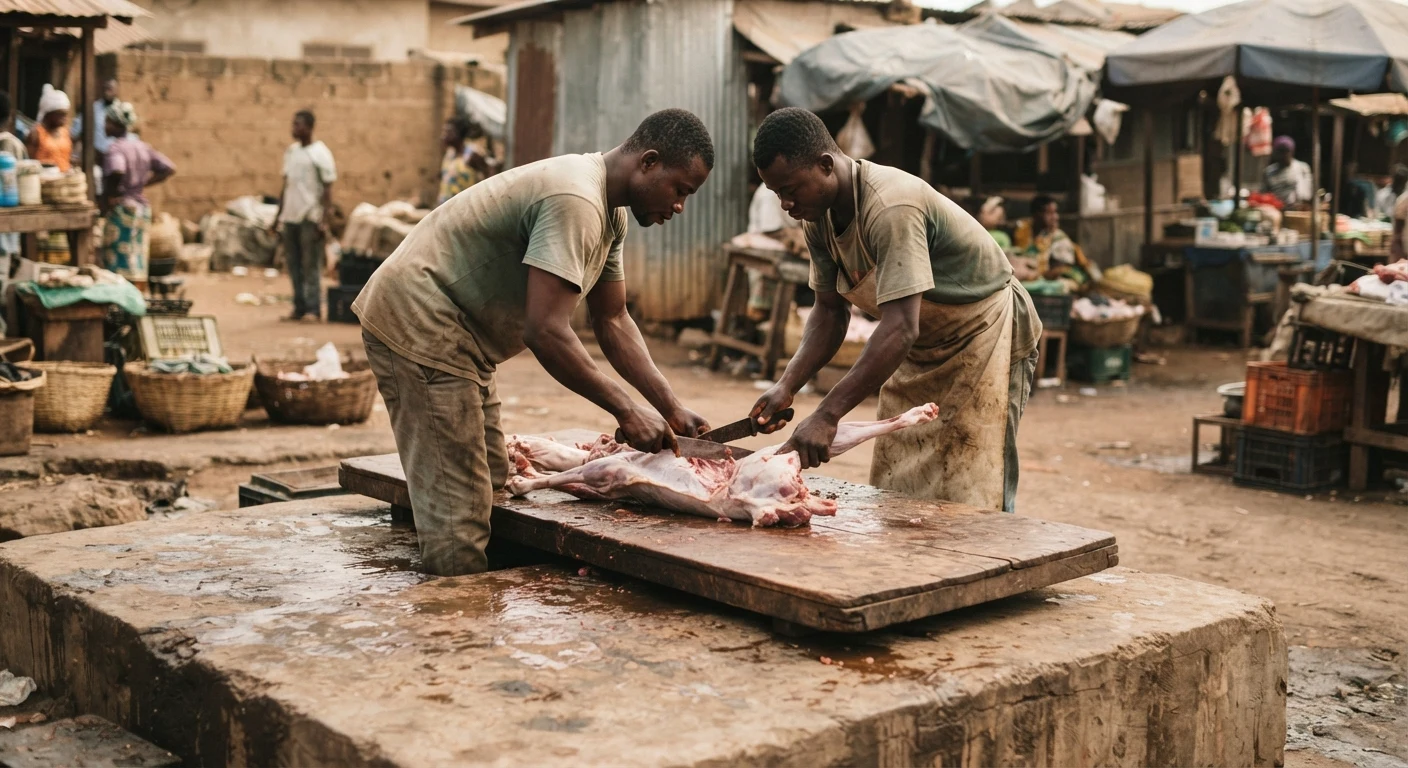
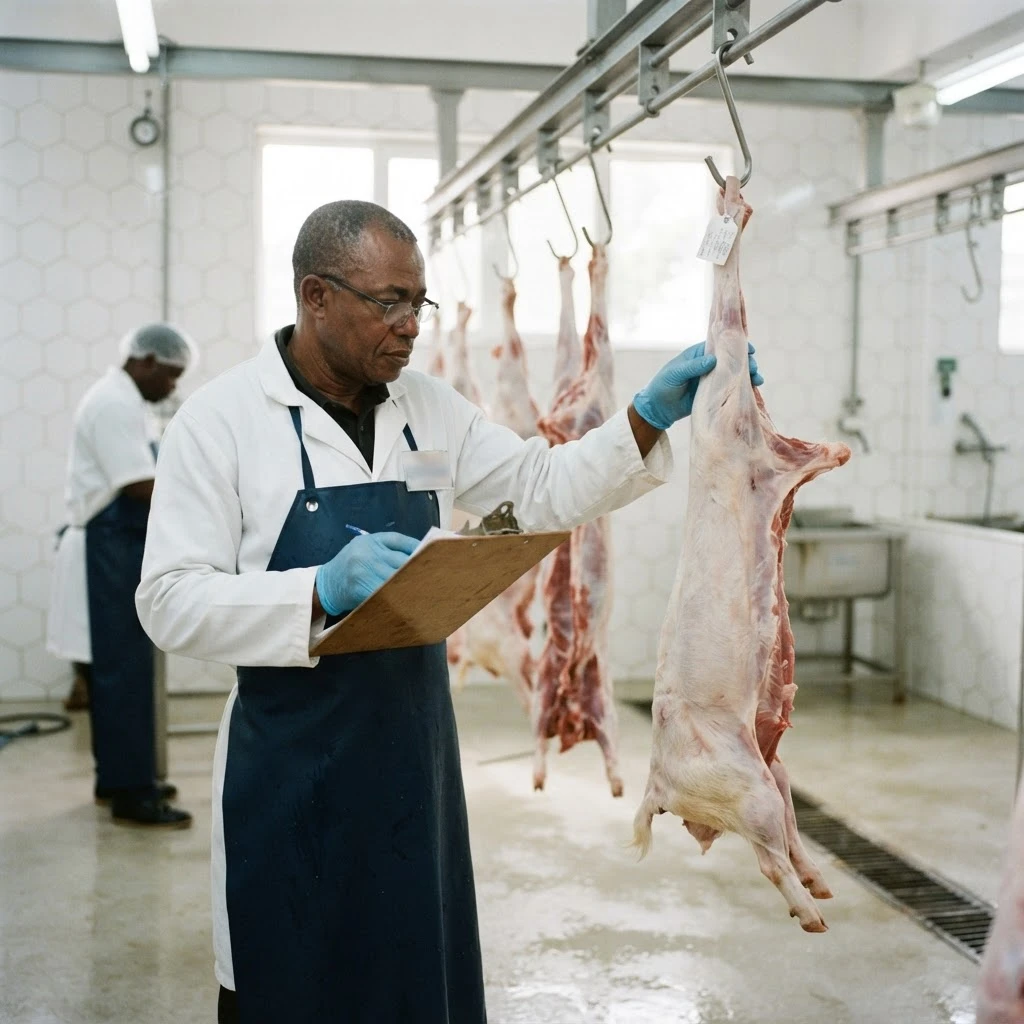
Most animals are slaughtered informally, at backyard slabs or small slaughterhouses. The Kumasi abattoir, the main formal facility in Ashanti, was built with a sheep and goat line that has since been converted to a second cattle line; a 2021 study put its sheep and goat slaughter at about 154 head a day, about a fifth of those slaughtered in the Kumasi area. Before Eid in 2026 it received more than 5,000 animals by 21 May, against about 3,000 in the same period of 2025. A 16-day postmortem survey there counted about 72 mature ewes and does slaughtered a day, which the authors extrapolate to about 26,095 mature females a year. In Tamale a new meat shop and abattoir opened at Bilipiela in December 2025, and in Accra the metropolitan assembly is due to commission a multi-purpose abattoir at Jamestown in September 2026. The question for an entrant is where the other animals are slaughtered.28929101130
The slaughter gap
Ghana’s agricultural statistics record 129,227 goats and 65,599 sheep passing inspected slaughter in 2024, about 195,000 head. MoFA estimates meat output instead of counting it: it assumes that 30 percent of the flock is taken off each year, at carcass weights of 13 kilograms for goats and 15 for sheep, and these assumptions reproduce its published meat tonnages. Applied to the national flock, the same assumptions give roughly 2.85 million goats and 1.89 million sheep taken off in a year. On that estimate, inspected slaughter is about 4 percent of the total. The share is an estimate, because the 30 percent off-take rate is an assumed parameter, and some off-take is sold live or exported before slaughter.18
Table 11The slaughter gap, built entirely from one publication's own numbers
Table 11: The slaughter gap, built entirely from one publication's own numbers
Measure
Figure
What it is, and where it comes from
Inspected slaughter, goats, 2024
129,227 head
Recorded slaughter passing veterinary inspection, MoFA SRID Table 4.22
Inspected slaughter, sheep, 2024
65,599 head
Same table. The two together are about 195,000 head
MoFA off-take parameter
30 percent of the flock a year
MoFA SRID Appendix 14, an assumed estimating parameter, used to derive the published meat series
Estimated off-take, goats
about 2.85 million head
The parameter applied to 9.52 million goats
Estimated off-take, sheep
about 1.89 million head
The parameter applied to 6.29 million sheep
Inspected share of estimated off-take
about 4 percent
195,000 against about 4.74 million. Both inputs are MoFA's own: Table 4.22 for inspected slaughter, and Table 4.28 with Appendix 14 for the estimate
Source: Statistics, Research and Information Directorate, MoFA (2024), Table 4.22 for inspected slaughter, Table 4.28 for the meat series and Appendix 14 for the off-take and carcass parameters. The arithmetic is the authors', from the ministry's published inputs.
That gap shows how much of the chain sits outside any formal system, and it is the largest unserved volume in the chain. A formal facility competes with a free, unregulated alternative that carries no compliance cost, so the viable model is contracted supply to a buyer who requires certification: a hotel, an institutional caterer, a supermarket or an export customer. Sell the certificate, and the slaughter comes with it.
An informal backyard slaughter slab in a Ghanaian market town, workers dressing a carcass on a concrete floor with basic tools, no refrigeration, documentary photographUpload photo · /images/goat-vc-slaughterslab.webp
One foetus per two adult females
The chain’s breeding capital is being consumed as meat.
49.7%
of does slaughtered at Kumasi were pregnant
GH¢3.53m
the top of the annual value forgone at one abattoir
Breeding females slaughtered pregnant
The postmortem survey at the Kumasi abattoir found that 49.7 percent of the does and 38.2 percent of the ewes slaughtered were pregnant; 96.3 percent of the losses were in mid pregnancy and 3.7 percent early, at a mean of about 69 days into a five-month gestation, with none near term; the authors put the net value forgone at between about GH¢2.76 million and GH¢3.53 million a year at that one abattoir, at the study’s own market prices of about GH¢245.60 for an average ewe and GH¢315.10 for an average doe, well below 2026 prices. Pillar 3 treats this as a health and management failure, which it also is, but here the reading is worse: the chain’s breeding capital is being consumed as meat, at one abattoir, at a rate of roughly one foetus for every two adult females killed, and the authors suggest that sellers may offer pregnant females because they look weightier and fetch more, and that dry-season cash needs push females onto the market29. Pregnancy is not routinely checked at ante-mortem inspection, so a pregnant female can pass as a fat one.29
The national flock therefore grows more slowly than its reproductive capacity implies, the mechanism behind the gap Pillar 1 describes between what the doe can produce and what the sector produces, and the value destroyed is larger than the abattoir sees, since a foetus lost is a breeding animal and its future progeny forgone, and an entrant looking to buy bred females finds the market competing for that same animal at meat prices. The fix is cheap: the check is missing for want of infrastructure and staff capability, and screening at the two or three largest facilities, with pregnant females diverted rather than slaughtered, could turn part of a measured annual loss into breeding stock, and needs a rule and trained inspectors more than new buildings.
Opportunity. The strongest evidenced opening here is also the least capital-intensive: buy the pregnant females the abattoir would otherwise slaughter, and so acquire bred females at or slightly above their meat value. It needs a standing arrangement with one abattoir, a quarantine paddock and somewhere to put the offspring, and a published postmortem survey shows the supply exists.
🐐 Link 7: butchery, retail and the consumer, the least measured end of the chain 🐐
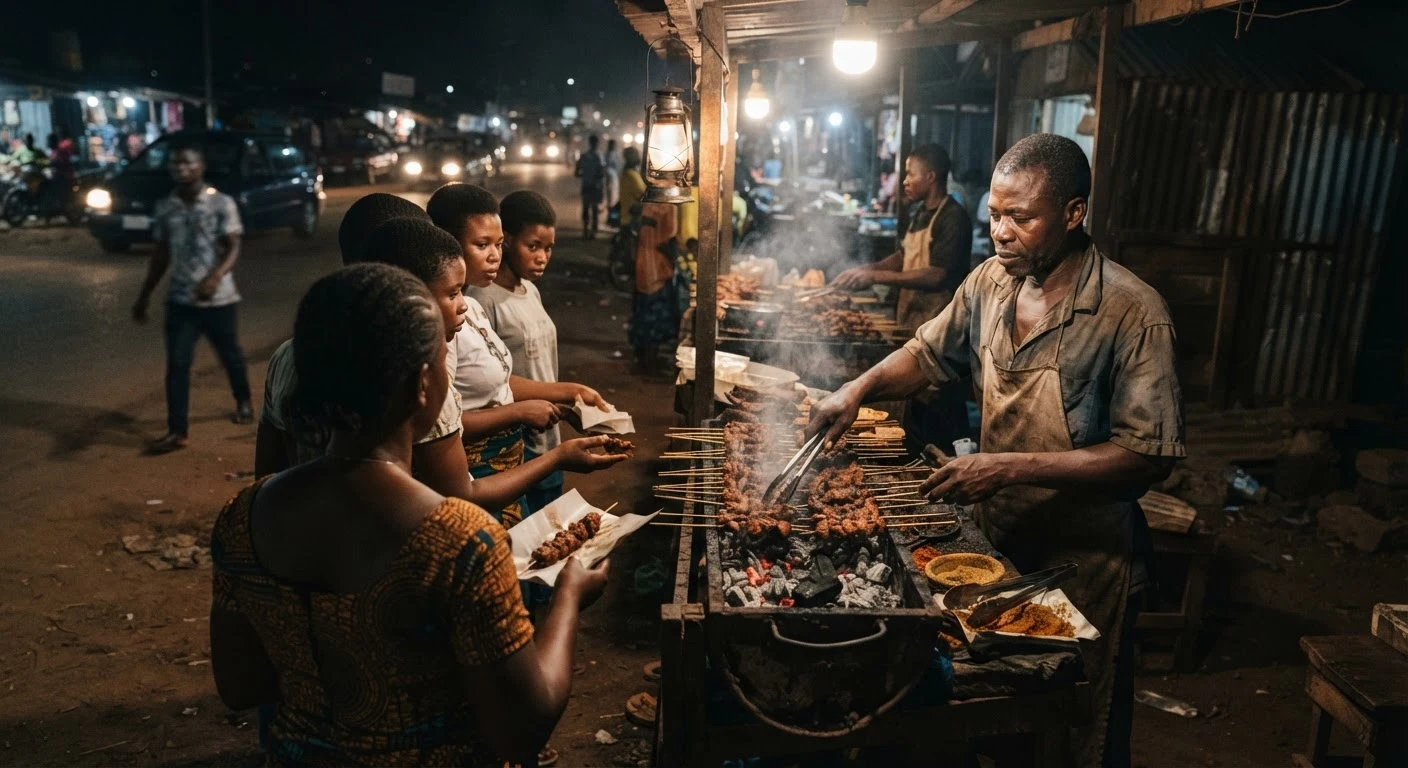
The retail end has the least evidence. The trader survey behind the margin figures stops at the trader’s selling price, and no published study measures a butcher, chop-bar or hotel margin in Ghana. Retail prices do exist: MoFA’s Statistics, Research and Information Directorate collects a national average monthly retail price for mutton, used in a 2023 price study, and Accra processors listed goat meat at about GH¢130 a kilogram in September 2026.234 What can be described is the structure: the animal is slaughtered at a licensed abattoir or, far more often, informally, then moves to the khebab trade, the largest and most visible outlet, to chop bars, to a small hotel and institutional segment that is the only buyer with a formal reason to care where the animal came from, or straight to a household that buys and slaughters it at festival time, removing the last two links altogether.
Most goat and sheep meat is sold warm, whole or in rough cuts, and unbranded. A few Accra firms now process and sell it portioned: Johnny’s Food and Meat Complex in Madina, operating since 2011, sells goat meat and smoked goat with cold-chain delivery to restaurants, hotels, caterers and supermarkets, and Parbs Foods lists goat stewing cuts, shoulder, leg and lamb chops from processing sites at Nungua and Lashibi. Imported frozen sheep and goat meat, about 1,400 tonnes in 2024 and 1,100 tonnes in 2025 in UN Comtrade, mainly from Australia, New Zealand, Belgium and the United Kingdom, is the packaged product most supermarket shoppers see. MoFA estimates domestic output at about 65,431 tonnes of goat and sheep meat in 2024. In the 2015 trader survey the live animal was about 60 percent of the trader’s selling price for goats and about 70 percent for sheep.3128181
A busy roadside khebab grill stand in Accra at night, skewers of grilled goat meat over charcoal, a vendor serving customers, documentary photographUpload photo · /images/goat-vc-khebab-stand.webp
The least measured link
The largest and most visible outlet for the meat, and the end of the chain with the least evidence.
65,431 t
of goat and sheep meat in 2024, MoFA's estimate
GH¢130/kg
goat meat from Accra processors, September 2026
An entrant into chilled meat has to build a cold chain, certified slaughter supply and a brand at the same time, which is why rows 5 and 6 of the ranked openings below start from a contracted institutional buyer.
🐐 Link 8: the by-product branch, hides, skins and leather 🐐
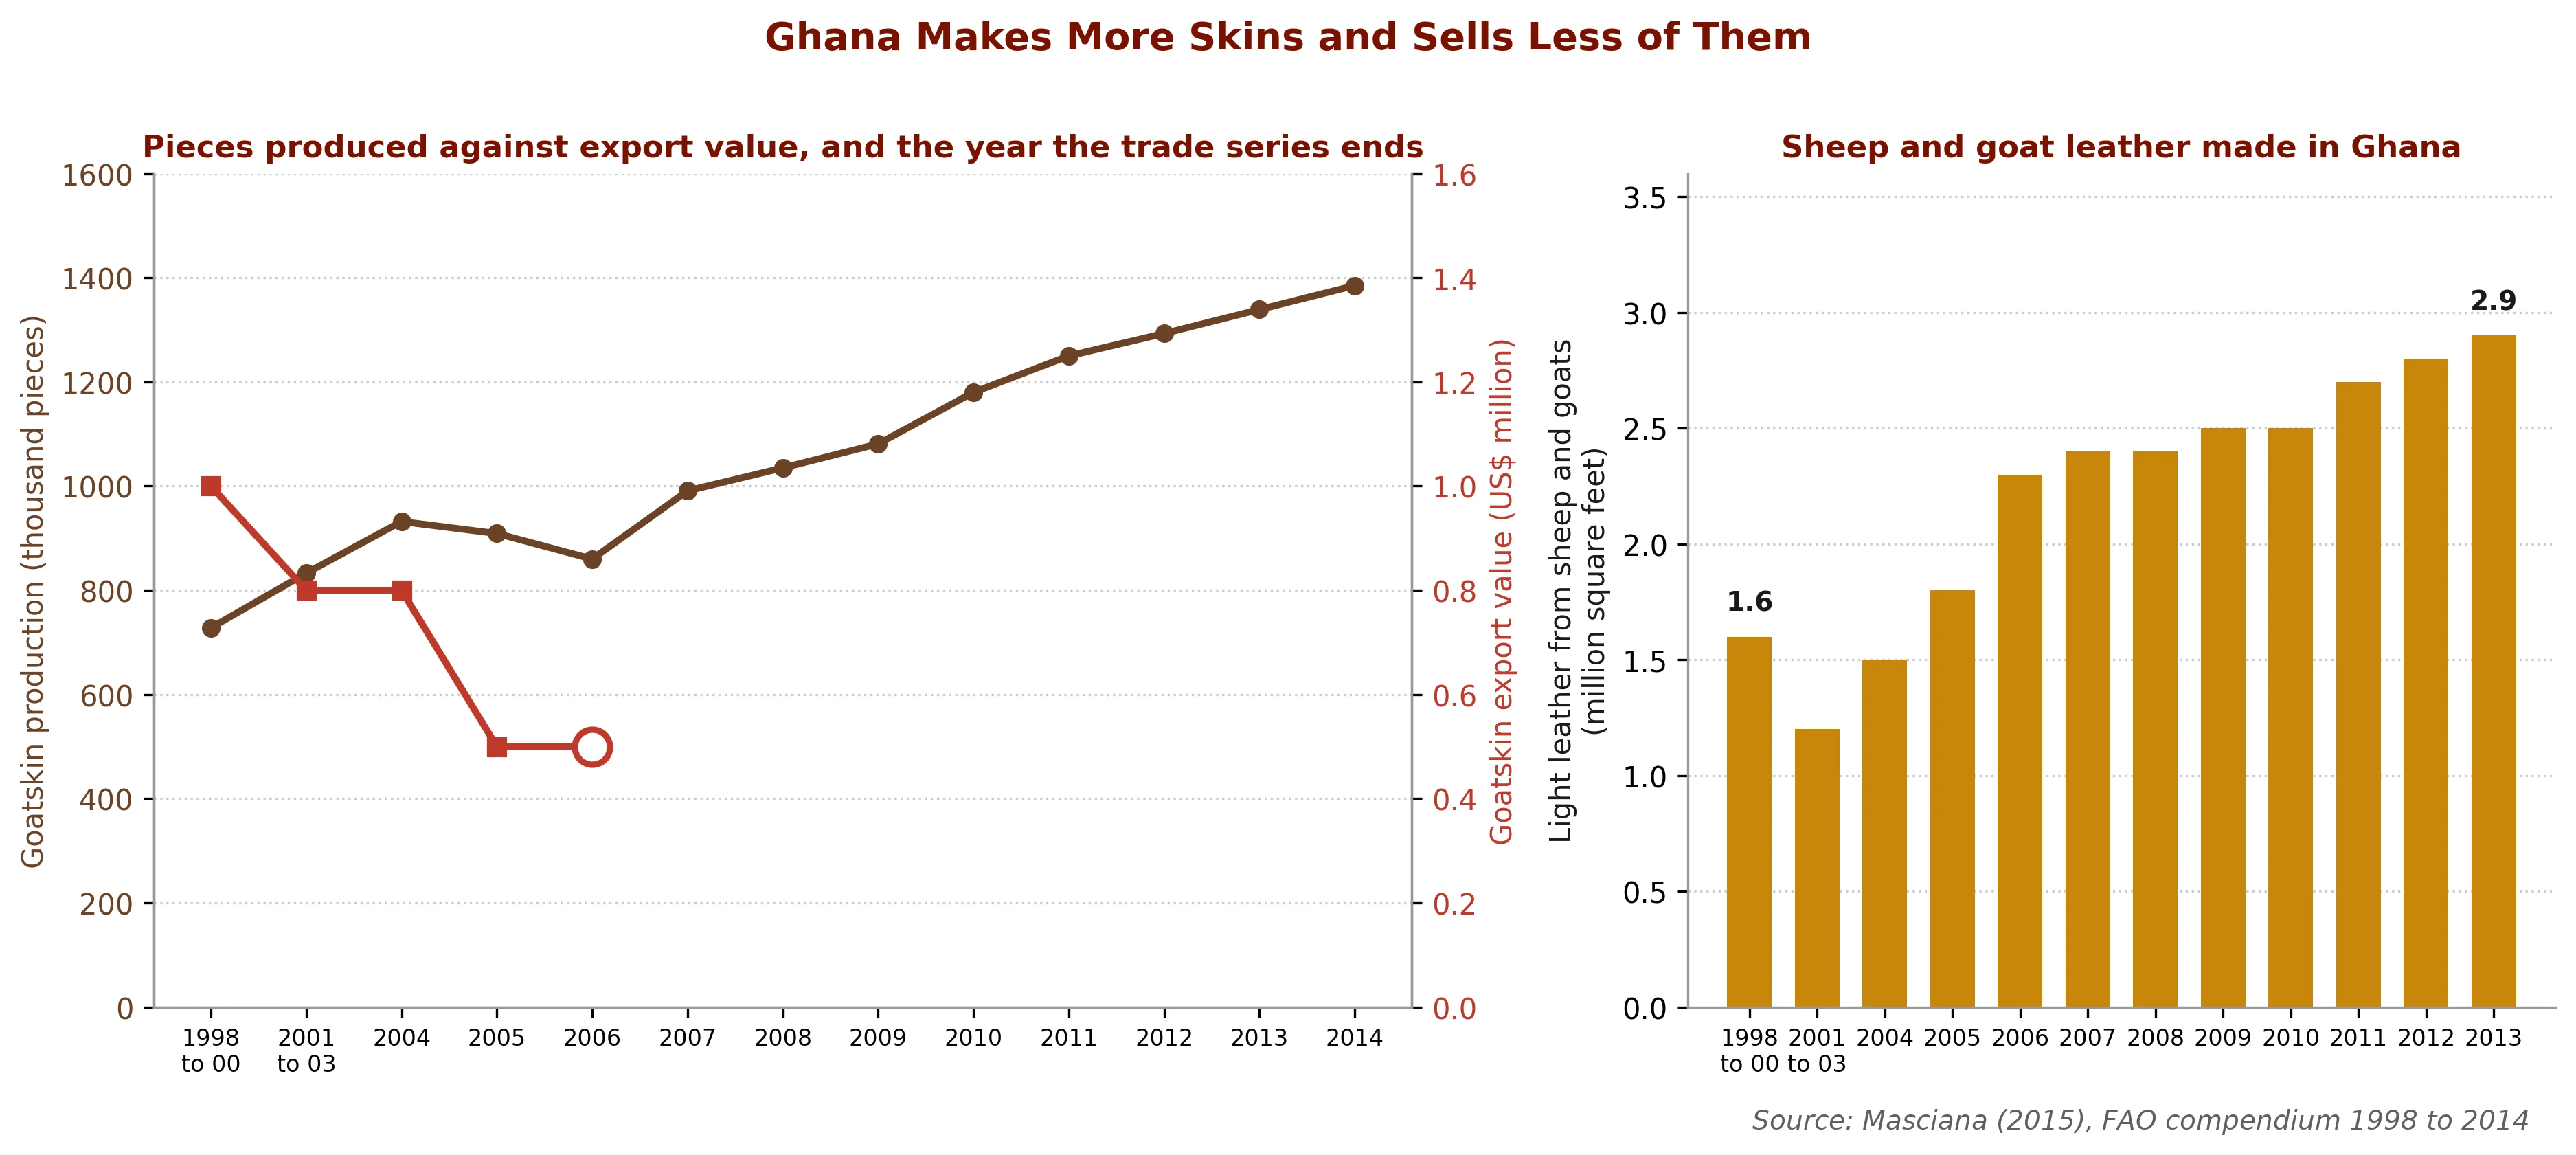
Ghanaian goatskin production rose to 1,385 thousand pieces in 2014, up from 728 thousand in the 1998 to 2000 average, close to a doubling, while the export value of raw goatskins fell from US$1.0 million in the 1998 to 2000 average to US$0.5 million in 2006. The FAO trade series ends there because the customs code for raw goatskins was deleted from the Harmonized System on 1 January 2007 for low world trade, and later exports are recorded with other raw skins under HS 4103.90. On that code Ghana recorded about 590 tonnes of raw skin exports in 2024 and about 515 tonnes in 2025, almost all to China; the code also covers other species, including donkey skins, so the goat share is not known. Ghana made 2.9 million square feet of sheep and goat light leather in 2013, up from 1.6 million in the 1998 to 2000 average, and FAO recorded no exports of it. UN Comtrade shows only a few kilograms of goat leather exported in 2022 and 2023, none in 2025, and about 19 tonnes of sheep leather imported from China in 2024.138
Figure 8 Goatskin production against goatskin export value, and the sheep and goat leather Ghana makes and never sells abroad
What this shows
The left panel puts the two goatskin series on one axis. Ghana nearly doubled its goatskin output while the export value of those skins halved, and the trade line ends in 2006 because raw goatskins lost their own customs code in 2007. The right panel is the manufacturing step: sheep and goat light leather output dipped in 2001 to 2003 and then rose to 2.9 million square feet in 2013, and FAO records that same figure as apparent availability in every year, which is how these statistics record a product that is never exported.
The unit trap in the skins data
Two tonnage figures circulate for Ghanaian skins, about ten times apart. One is green weight and one is dry weight. Check which you are being quoted before you price anything.
Table 12Green weight against dry weight: two Ghana skin series that must never be mixed
Table 12: Green weight against dry weight: two Ghana skin series that must never be mixed
Series
What it measures
Ghana figure
Why it cannot be compared with the other
FAOSTAT skin production, 2024
Green weight, straight off the carcass
7,155 tonnes of goat skins and 4,546 tonnes of sheep skins
An FAO estimate of green weight, built by FAO and not from MoFA's parameters
Masciana FAO compendium, 2014
Dry weight, after preservation
About 0.7 thousand tonnes of goatskin and 0.4 thousand tonnes of sheepskin
Consistent with 1,385 thousand pieces at roughly half a kilogram dry each
The two series on piece count
How many skins are recorded at all
1,385 thousand goatskin pieces in 2014, against 1,420 thousand goats recorded slaughtered in the same year
The piece count is FAO's own slaughter count, so the two cannot be differenced into a collection gap
Sources: FAOSTAT (2024) for the green-weight production series; Masciana (2015), compiling the FAO world statistical compendium for raw hides and skins for 1998 to 2014, for the dry-weight and piece-count series. Neither series corrects the other and neither may be converted into the other.
The two series cannot be used to derive a collection loss rate. They show the direction of travel: recorded skin output roughly doubled to 2014 while the value of raw goatskin exports halved to 2006. Much of the loss happens at slaughter: goats and cattle are commonly singed so that the skin is eaten with the meat, a practice a 2025 study sampled at abattoirs in Kumasi, Accra, Koforidua, Tamale and Ho, and a singed skin cannot be tanned. In an Ethiopian case in the GIZ ValueLinks manual, collection, preservation and raw-skin trade received little support compared with husbandry and manufacture.1431
An artisanal vegetable tannery at Zongo in Tamale, raw goat and sheep skins stretched and drying in an open-air yard with no signage, a worker curing hides by hand, documentary photographUpload photo · /images/goat-vc-tannery.webp
Demand sometimes outstrips supply
A vendor selling up to 20 pairs of sandals a day at festive peaks, from a site with no signage at all.
1,385k
goatskin pieces recorded in 2014, up from 728k in 1998 to 2000
27%
of Africa's livestock exports are unfinished leather, hides and skins
What the branch looks like on the ground, and what it is worth
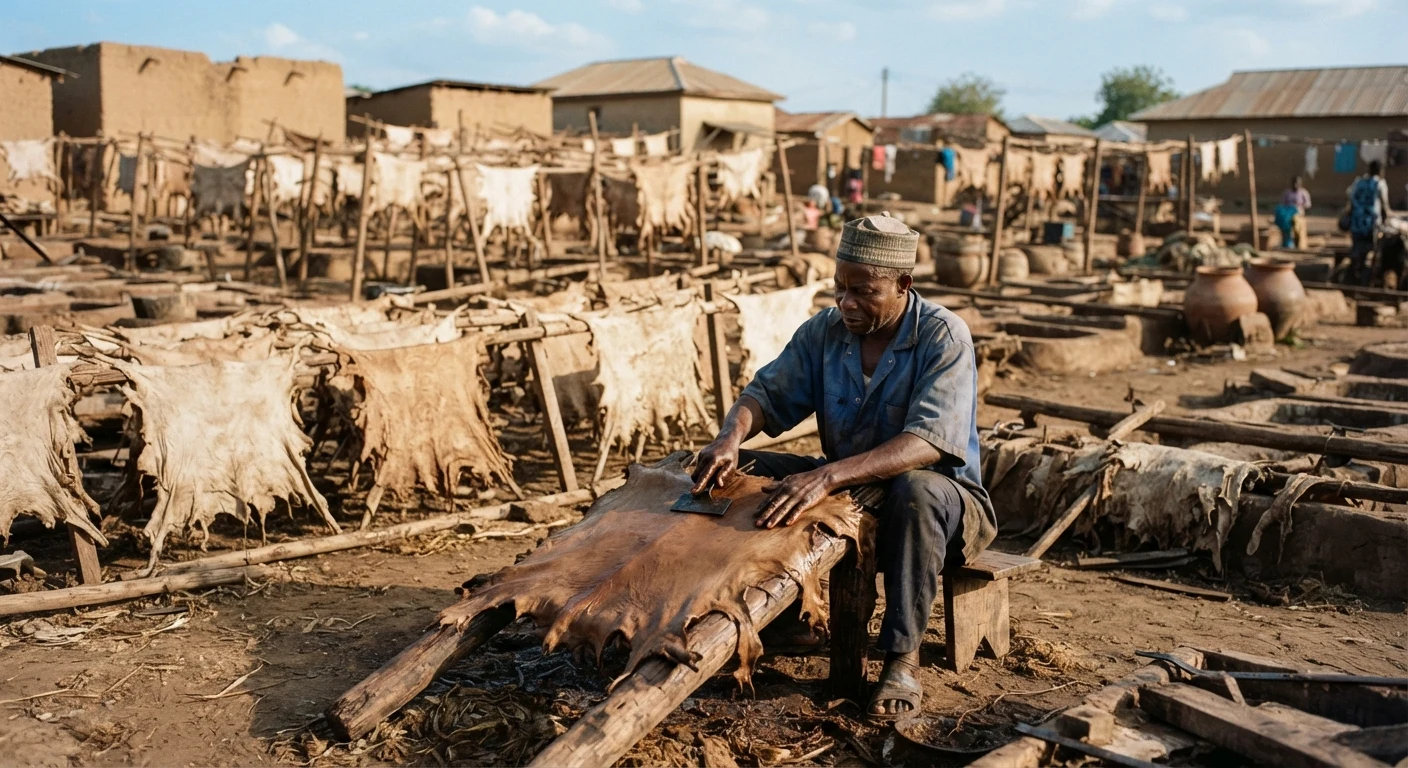
Artisanal vegetable tanning is documented in the northern sector and in the Ashanti and Greater Accra regions32; the site documented most recently and most specifically is the leather tannery at Zongo in Tamale, using indigenous vegetable tanning; a vendor there reports selling up to 20 pairs of sandals a day at festive peaks33, with demand for sandals sometimes outstripping supply when customers do not order ahead, though the operation runs out of abandoned structures with no signage or marketing.
Across Africa, unfinished leather and hides and skins make up 27 percent of Africa’s livestock exports, largely without any value addition34, a continental figure, and Ghana fits it: more skins produced, less value received.
Opportunity. The opening is skin collection: a business that pays slaughter slabs a small sum per skin, trains the flayers, and salts and grades on the spot buys a waste product and sells a raw material to the existing tanners and to exporters. The hard part is being at the slab when the animal is opened, and persuading butchers to flay goats they would otherwise singe.
🐐 The price and margin ladder, on measured prices 🐐
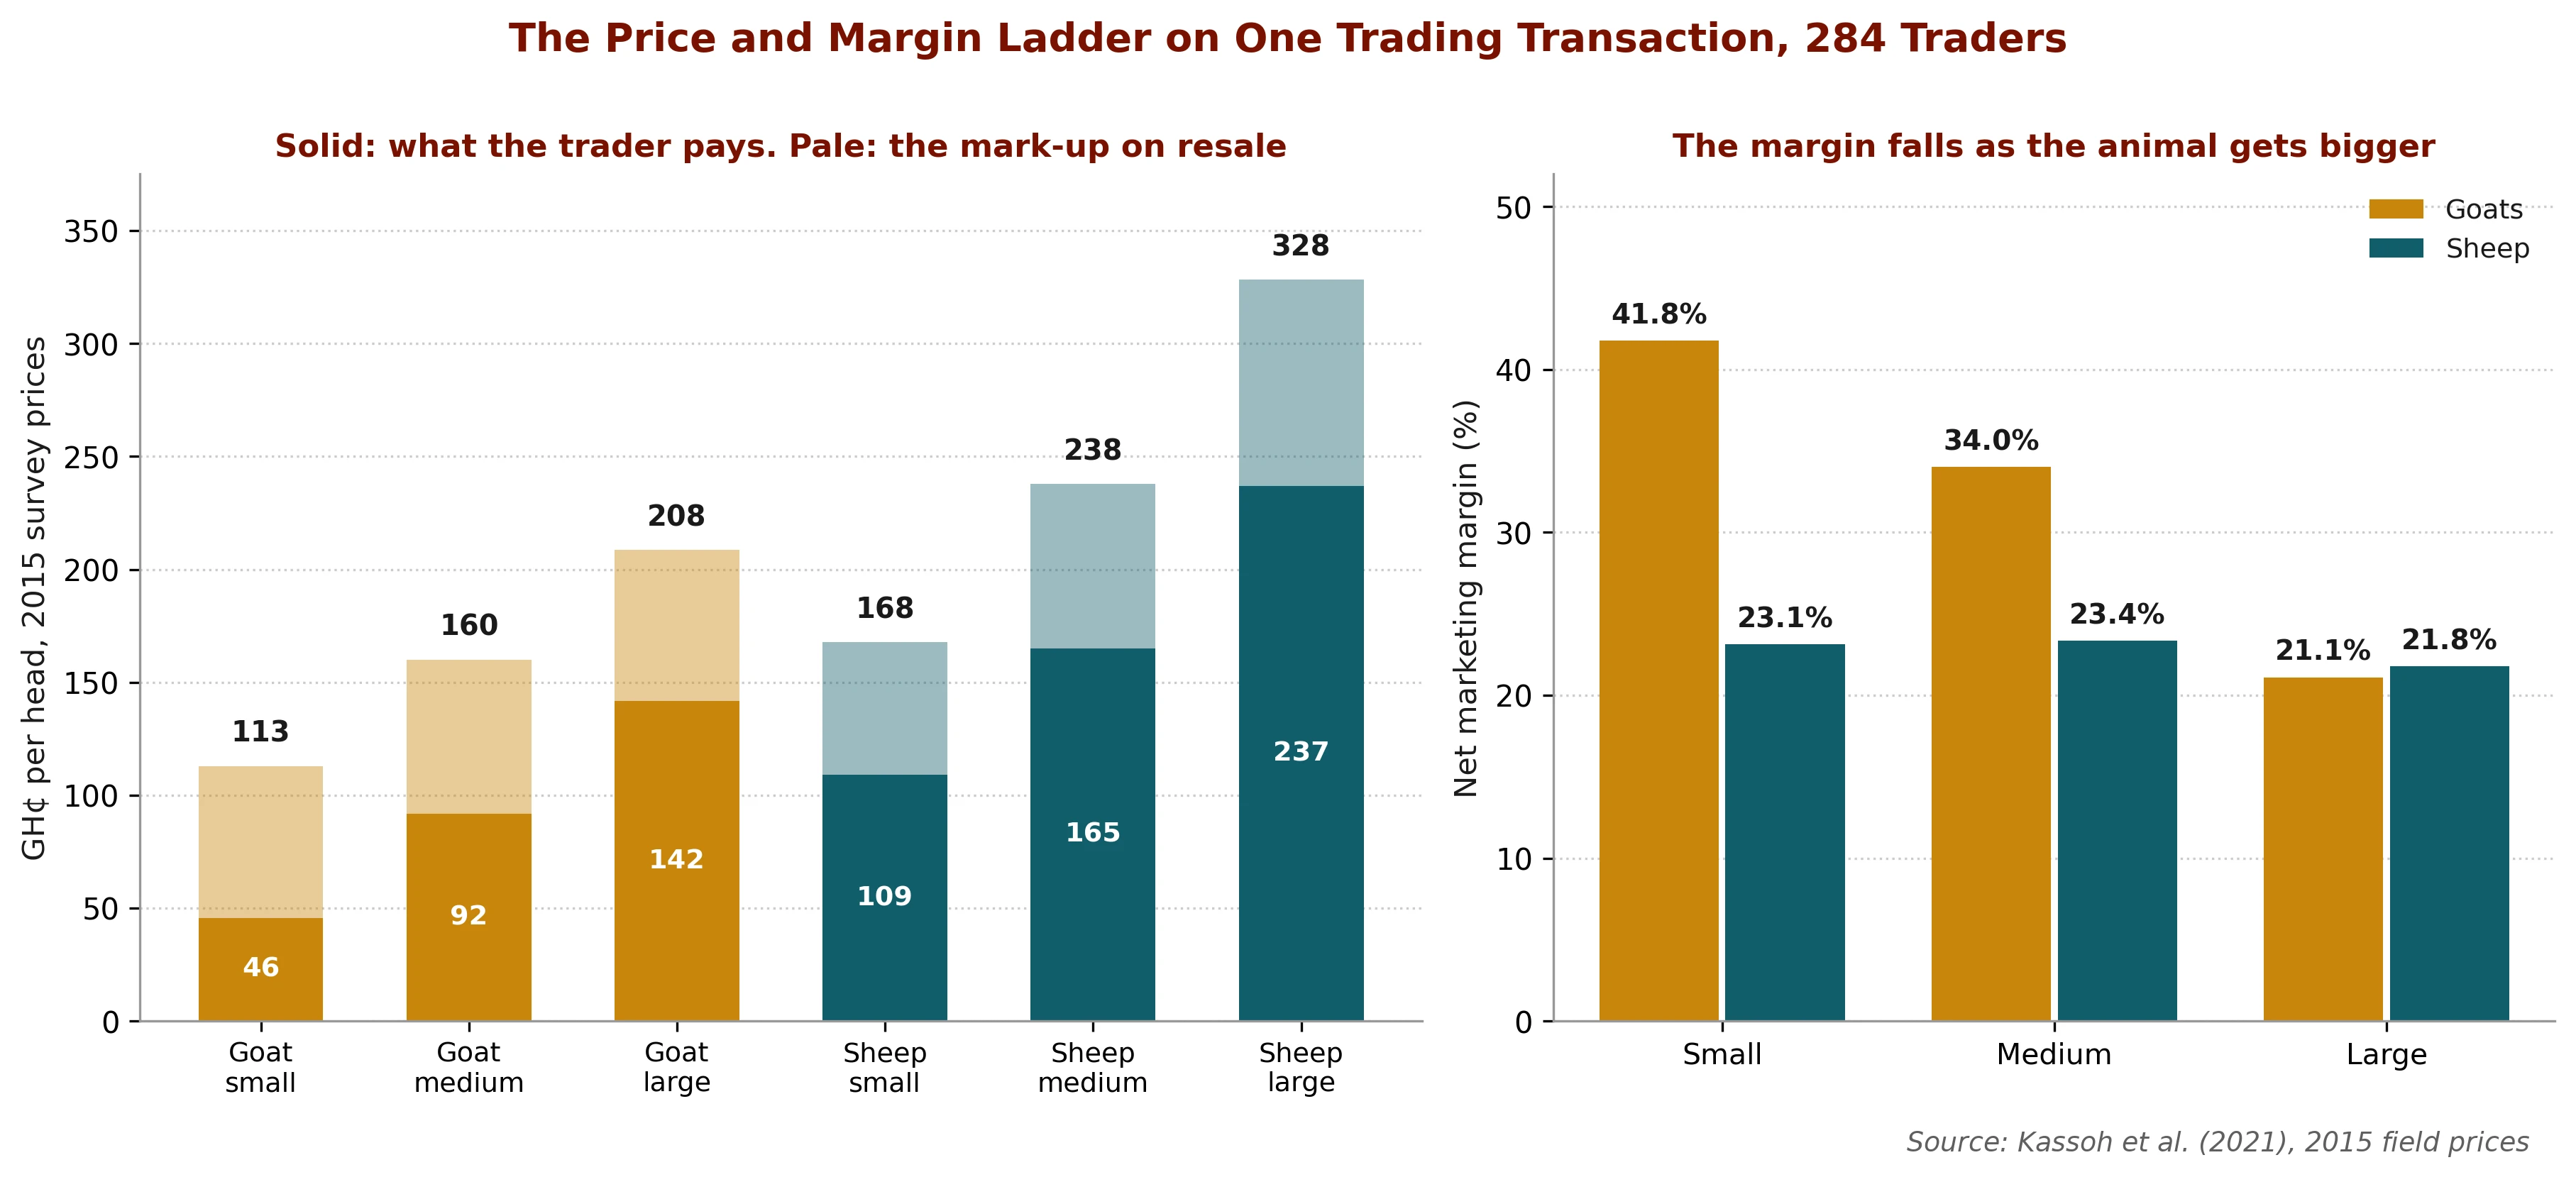
The trader survey of 284 traders, 2015 fieldwork published in 2021, gives the margin structure; its cedi prices are 2015 prices. At 2015 prices, goats bought for about GH¢100 sold for about GH¢168 and sheep bought for about GH¢176 sold for about GH¢253; at Kumasi before Eid in 2026 rams started from about GH¢1,5009, so the cedi figures show structure only. Against the 2015 prices the net marketing margin is about 24.85 percent for goats and about 17.73 percent for sheep, or, in the study’s words, about GH¢0.25 and GH¢0.18 on every cedi invested, which per animal is about GH¢41.65 a head and about GH¢44.87 a head.1
Figure 9 What the trader pays and what the trader sells for, by species and size class, with the net marketing margin on the same transaction
What this shows
The transaction actually measured, across 284 traders in Kumasi and Tamale. The left panel is the price ladder, solid for what the trader pays and pale for the mark-up on resale; the right panel is the net margin on that same transaction. Read the right panel from left to right: the goat margin falls as the animal gets bigger while the sheep margin barely changes, so the widest percentage margin is taken on the small goat, which is the one a producer is most likely to sell off the farm gate. The prices are 2015 field prices and show structure only.
The margin-by-size pattern already noted at Link 2 holds here too, and the margin itself is a per-transaction return: the study’s own comparator, a return on savings of 22 percent at the time of the survey, which goat trading beat and sheep trading did not, is an annual rate, while the trader turns the money over about thirty-six times a year; brokers, counted separately and on a different panel, visited the market about ten times more often than other traders. These are the trader’s net margins. Pillar 5 carries the producer-side cost model and sensitivity analysis.1
🐐 Digital in the chain: traceability, cold chain and the marketplace 🐐
Three digital layers would change this chain, at very different distances from being real in Ghana.
Traceability. The slaughter gap makes conventional traceability close to impossible, since an animal that never passes an inspected facility never acquires a record. The regional precedent, Livestock247 in Nigeria, reports 110,123 traceable animals and 277,168 vaccinations administered across fifteen Nigerian states35, self-reported and Nigerian, demonstrating only that a chain-level register is commercially operable in West Africa, with no Ghanaian equivalent for small ruminants. The feasible Ghanaian version starts far smaller: one flock and one notebook or free phone app recording ear tag, dam, birth date, weight and treatments, at little more than the cost of the tags.35
Cold chain. This is commercial only, and in 2026 it is run by a few Accra processors that deliver chilled goat meat to hotels, restaurants, caterers and supermarkets3, and limited storage, abattoir and processing capacity is named as a constraint on small and medium livestock producers across Africa in the same continental African Development Bank framework cited in the by-product section above. The nearest national infrastructure, a general cargo centre at Kotoka International Airport opened in 2016 and a programme of grain warehouses36, is not small ruminant specific. A cold chain is a capital project that needs a contracted buyer behind it.36
Market information. Esoko, a Ghanaian firm, first sent crop prices to farmers by SMS and now runs surveys, messaging and rural e-commerce; neither source documents goat or sheep prices, so a livestock price service is a proposal. Its 2012 case study records lessons that transfer more directly than its successes: unusable existing price content, a single-commodity feed not enough to hold users, client acquisition rather than technology as the binding constraint, and scale reached through organisations already working with farmers.37
The digital layer splits cleanly: records, mobile money receipts and a phone photograph of an animal with its ear tag are feasible now at no capital cost, turning an animal into something a lender can assess, while camera-based disease detection and satellite-triggered insurance exist elsewhere on the continent and nowhere yet here. Pillar 8 consolidates the tool-by-tool view.
One flock, one notebook
Records as collateral
Livestock prices still a proposal
🐐 The missing middle, named and diagnosed 🐐
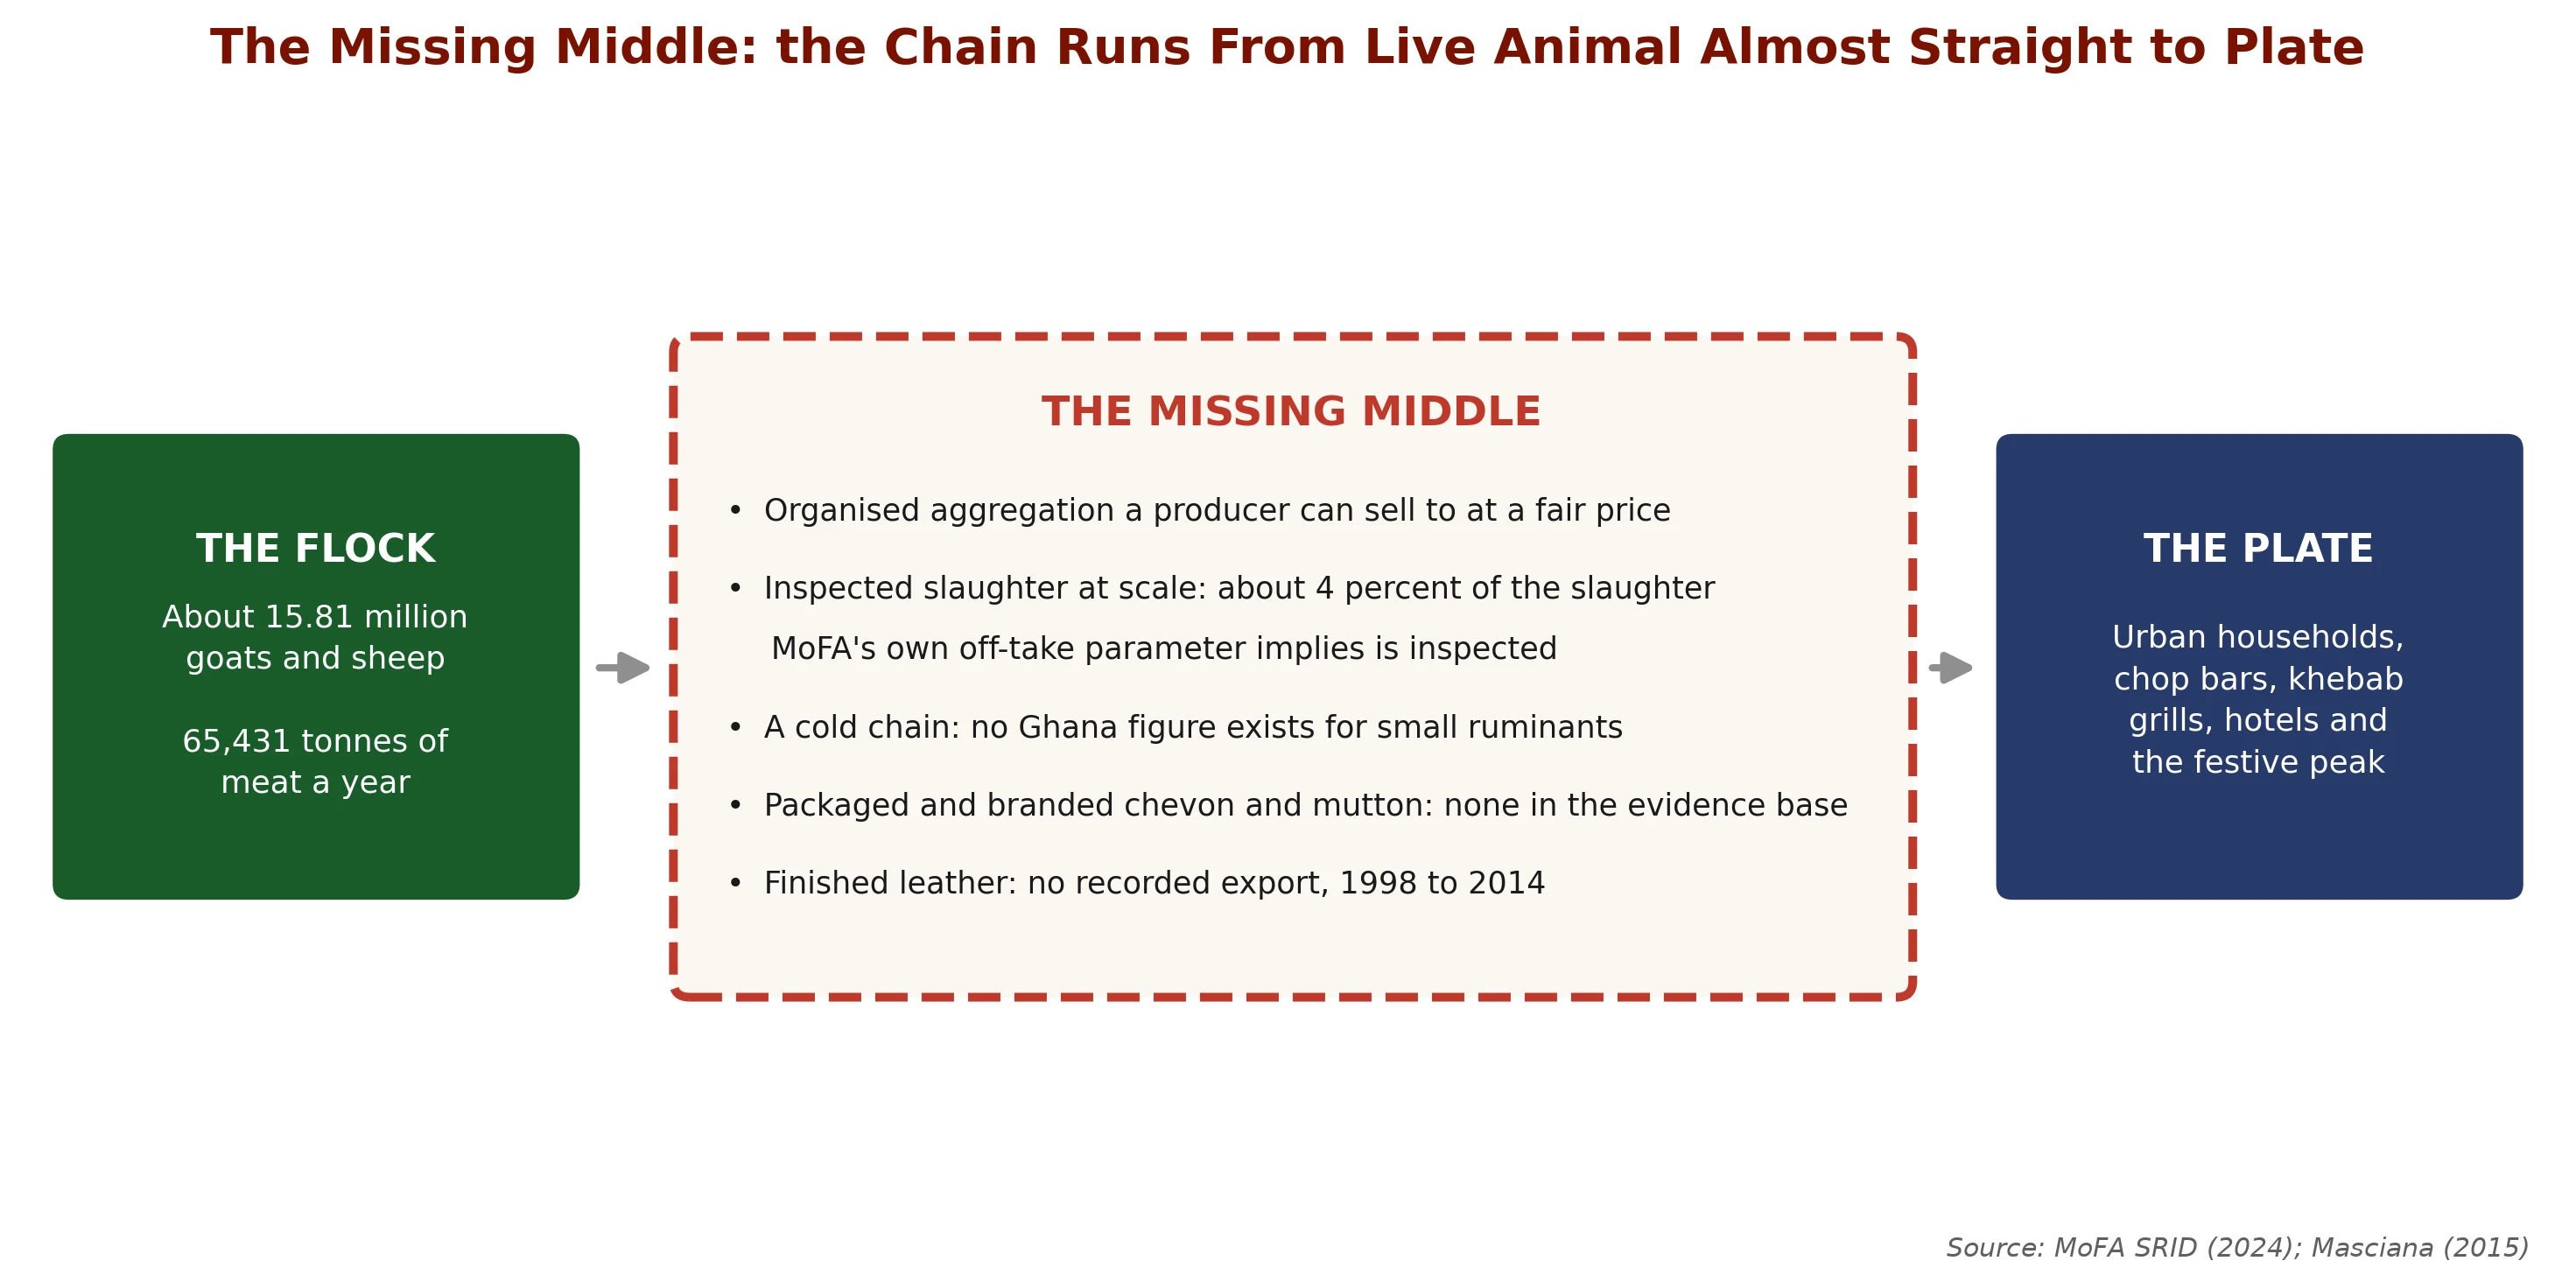
Put the eight links back together and Ghana has a large flock and a large appetite, with a thin middle between them: little organised aggregation a producer can sell into at a fair price, little inspected slaughter, a cold chain that serves only a few Accra processors, and almost no finished leather reaching a market.
Figure 10 What sits between the flock and the plate in Ghana, and what does not
What this shows
The broken box lists what is missing: about four percent of implied slaughter inspected, a cold chain limited to a few Accra processors, packaged goat meat sold by only a handful of firms, and almost no recorded export of sheep and goat leather in FAO data for 1998 to 2014 or UN Comtrade data for 2022 to 2025. The links do not fail one at a time. They need each other, which is why this middle has stayed empty while each individual piece of it has looked attractive.
Four causes are visible, each pointing at a different remedy. The informal alternative is free, since an uninspected slab avoids the inspection, licensing and hygiene costs a formal abattoir carries while competing for the same animal, so only a buyer requiring certification closes that gap. The missing links also need each other: packaged meat needs a cold chain, a cold chain needs volume, volume needs certified slaughter, and certified slaughter needs a buyer who pays for the certificate, so any one built alone fails on the absence of the others. The third cause is capability: on the same continental African Development Bank framework cited for the leather share above, most African countries still lack the capability to transform raw material into a manufactured product, and skills and market access are more of a barrier than equipment. The fourth is that the actors with most power over the day-to-day trade, traders and brokers, gain little from a formal middle, the subject of the next section.
Certified slaughter
Cold chain
Packaged brand
Retail shelf
🐐 Who holds power over this chain, and who actually wants it formalised 🐐
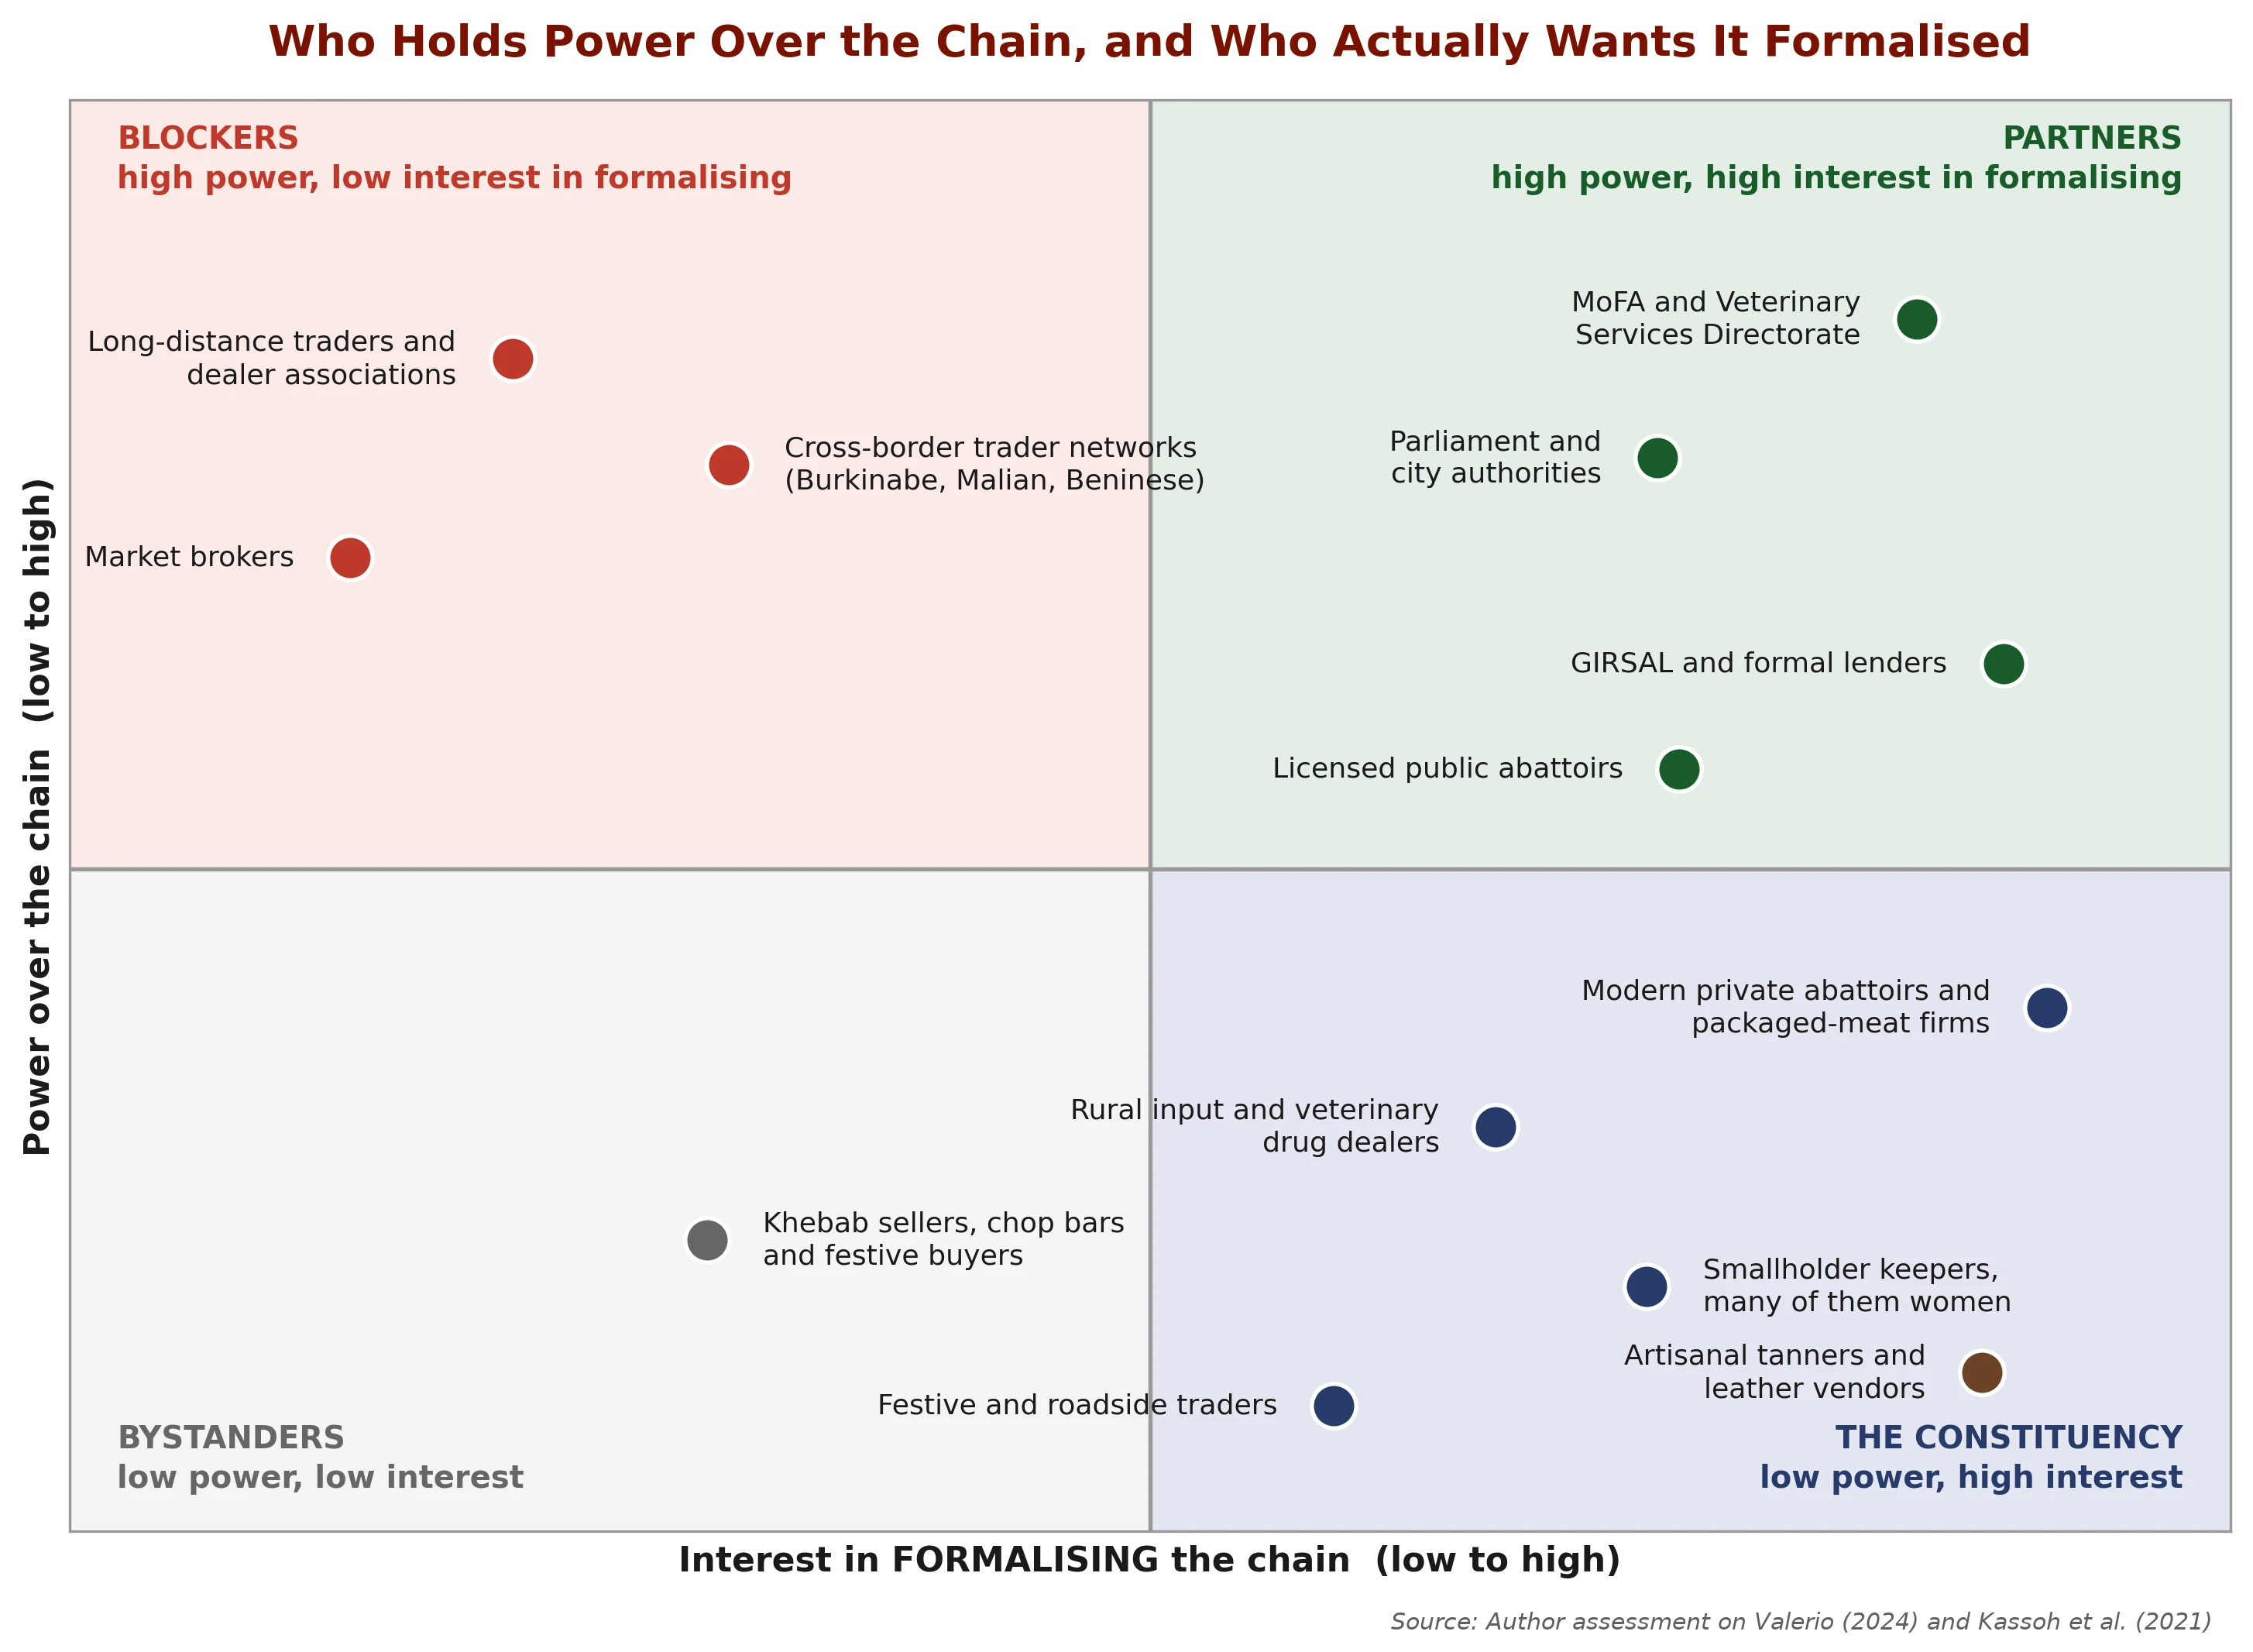
Everyone in the sector is interested in it, so the map below plots power against interest in formalising the chain, and the actors sort very differently than on the conventional grid.
Figure 11 Power over the chain against interest in formalising it, with all four quadrants read
What this shows
The horizontal axis is interest in formalising the chain. Ghana’s small ruminant trader and broker layer sits top left, in the blocker quadrant. The partner quadrant is public or state-backed, with commercial lenders beside GIRSAL, so it can compel and fund change but does not run the trade. The crowded bottom-right constituency is the signature of a chain waiting for an organiser, and the near-empty bystander quadrant says almost nobody in goats and sheep is indifferent to how this chain is run.
Quadrant by quadrant: the top-left blocker quadrant holds the traders, brokers and cross-border networks, the actors with the most power and the least reason to want change, since formalisation erodes every source of their advantage: frequency, relationships and information; this reverses the advice that would follow from treating them as partners. Transact with this layer and build change where it has no control. The top-right partner quadrant is public, state-backed or regulated, MoFA and the Veterinary Services Directorate, Parliament and city authorities, licensed abattoirs and the state-backed credit guarantee, with real power and a clear interest in a formal chain, as the Kanda enforcement action shows, but public actors can compel and fund and cannot operate, so this quadrant supplies the mandate and the money, and others run the business.
The bottom-right quadrant, the constituency, is the crowded one: smallholder keepers, rural input dealers, artisanal tanners, festive roadside traders and the few modern private abattoirs and packaged-meat firms all want a more formal chain, for different reasons, and none can bring it about alone, the signature of a chain waiting for an organiser, and where an entrant necessarily starts, so a new business’s first job here is aggregating interest as well as animals. The bottom-left bystander quadrant is nearly empty: the one population sitting there is the khebab and chop-bar trade, buying warm meat cheaply and daily and unwilling to pay more under any formal arrangement, which matters commercially because the largest visible outlet for small ruminant meat is the one least likely to buy a certified, chilled, higher-cost product, the strongest argument here for targeting institutional buyers first.
Table 13The chain's actors, sorted by power and by appetite for a formal chain
Table 13: The chain's actors, sorted by power and by appetite for a formal chain
Actor
Role in the chain
Power
Interest in change
What it means for an entrant
Long-distance traders and dealer associations
Buy at the gate, sell in the city
High
Low
Your buyer and your competitor at once. Transact, do not confront, and never depend on one of them for the whole batch
Market brokers
Match buyer to seller inside the market
High
Low
At Kumasi, in the market about ten times as often as other traders in 2013 to 2017. Budget for the fee and use them for information rather than fighting them
Cross-border trader networks, Burkinabe, Malian and Beninese
Run the Sahel to Kumasi corridor
High
Low
Outside Ghanaian jurisdiction, and routes shift: Togo supplied about 43 percent of recorded live import head in 2025, and Kumasi intake rose in May 2026 while Burkina Faso’s exports were suspended. Watch the border and the market report together89
MoFA and the Veterinary Services Directorate
Inspection, licensing, animal health, statistics
High
High
The partner for anything requiring certification, and the source of the parameters your market sizing depends on
Parliament and city authorities
Market siting, permits, sanitation
High
High
Can close a trading site at short notice. Never build a plan on a temporary or unpermitted market
GIRSAL and formal lenders
Credit guarantees for agribusiness
High
High
Interested in exactly the formal, documented operations this chain lacks, and livestock is a named eligible sub-sector. Records are the entry ticket
Licensed public abattoirs
The only inspected slaughter in the chain
High
High
Contract slaughter here before you build anything of your own; confirm spare capacity facility by facility; Kumasi has converted its sheep and goat line to cattle, and new facilities opened in Tamale in December 2025 and are due in Accra in September 2026281011
Modern private abattoirs and packaged-meat firms
The missing middle, in embryo
Low
High
Few and small, such as Johnny’s Food and Meat Complex in Madina and Parbs Foods at Nungua and Lashibi. Treat them as buyers and collaborators312
Rural input and veterinary drug dealers
Drugs, feed and advice, thinly spread
Low
High
Distribution you can rent rather than build. They want more volume as much as you do
Smallholder keepers, many of them women
Own the animals, capture the least
Low
High
Your supply base. Organising them is the biggest move available, and the slowest
Festive and roadside traders
Two weeks of intense seasonal trade
Low
Moderately high
They want a proper site, and in May 2026 the Kanda traders said Accra Central has no designated market. A designated market turns a nuisance into a channel25
Artisanal tanners and leather vendors
The main leather processing in the country, beside singeing for food and raw-skin export
Low
High
A ready buyer for graded raw skins and a demonstration that the craft exists. Supply them before competing with them
Khebab sellers, chop bars and festive buyers
The largest visible outlet for the meat
Low
Low
Price-driven and indifferent to certification. Not the first customer for a formal product
Sources: Kassoh et al. (2021) for the trader profile; Valerio (2024) for brokers and the cross-border trader communities, measured across West Africa; Asare (2026) for the Kanda market dispute and the parliamentary and ministerial action; Bank of Ghana (2024) for GIRSAL; Fugu and Baba (2025) for the tannery; Clottey et al. (2007) for the input dealers. Power and interest positions are the authors' assessment on that evidence, following the actor levels in Springer-Heinze (2018).25
Market signal. An entrant must align with the partner quadrant and recruit from the constituency, expecting neither to move first: one relationship with a licensed abattoir or the veterinary service for a certificate to sell, one with a lender or guarantee scheme that treats records as collateral quality, and a producer group organised yourself. Treat the blocker quadrant as a well-run business to buy services from while you build the part of the chain it has no interest in occupying.
🐐 The value-capture openings, ranked 🐐
The order below runs from the opening with the strongest evidence and lowest capital requirement to the largest prize and longest odds.
Table 14Seven openings in this chain, ordered by evidence and by what each actually costs to start
Table 14: Seven openings in this chain, ordered by evidence and by what each actually costs to start
Rank and opening
What the evidence says
What it requires
Who it suits
1. Buy breeding females out of the slaughter queue
Half the does and nearly two in five ewes slaughtered at Kumasi Abattoir were pregnant, while improved breeding stock comes mainly from state stations such as Ejura, a few private importers of Boer goats and online sellers6738
One standing arrangement with an abattoir, a quarantine paddock, feed, and somewhere to put the offspring
A first-time entrant with land and very little capital
2. Skin collection, preservation and grading
Recorded skin volume roughly doubled while export value halved and then stopped being reported; collection is the identified neglected step, and a Tamale tannery reports demand for its sandals sometimes outstripping supply; many skins are singed and eaten with the meat14
A vehicle, salt, a shed, a grading standard and a route round the slaughter slabs
A working-capital business
3. Producer aggregation with contracted offtake
Trader margin is widest on the small farm-gate animal and turnover is about thirty-six batches a year; the producer has neither volume nor information
Twenty to fifty keepers, a collection calendar, weighing, and one buyer who will sign for volume
An organiser with local relationships
4. An input and animal-health subscription round
Input dealers do not stock what nobody buys, and vaccine delivery priced per livestock unit has been tested in Ghana by Cowtribe since 2016
A route, a vet partnership, a schedule and a payment method that works on a feature phone
A small service business that scales by route density
5. Certified contract slaughter and chilled portioning
Inspected slaughter is about four percent of the implied total, and Kumasi Abattoir has converted its sheep and goat line to cattle, so small ruminant capacity must be confirmed facility by facility28
A contracted institutional buyer first, then contract slaughter at an existing licensed facility, then cold storage
A trade business with a signed order book
6. Packaged and branded chevon and mutton
Only a few Accra processors sell packaged, chilled goat meat, at about GH¢130 a kilogram in September 2026, and MoFA collects a monthly mutton retail price series to plan against342
Everything in row 5, plus a brand, a shelf, a cold chain and the working capital to carry all four
A funded company, and only after rows 3 and 5 are working
7. Finished leather for an export market
Sheep and goat leather production nearly doubled to 2.9 million square feet with no recorded export in FAO data for 1998 to 2014 and only a few kilograms in UN Comtrade data for 2022 to 20258
Row 2 at scale, a tannery meeting buyer standards, effluent management and a foreign buyer
A long-horizon industrial investor, or a public programme
Sources: Mohammed and Anane (2022) for the pregnant-female evidence; Masciana (2015) and FAOSTAT (2024) for the skins and leather series; Kassoh et al. (2021) for the margin, turnover and cost structure; Statistics, Research and Information Directorate, MoFA (2024) for inspected slaughter; Awafo and Amenorfe (2021) for abattoir capacity; Idris (2019) for the subscription vaccine model. The ranking is the authors' judgement on that evidence.
The biggest prizes sit at the bottom of that list, because packaged meat and finished leather each need three or four other links to be working first, and most are missing or small. The top opening needs only a paddock and an arrangement with an abattoir.
🐐 Openings: where the missing links are 🐐
01
The by-product branch. Recorded goatskin output nearly doubled to 2014, Ghana exported about 515 tonnes of raw skins in 2025, almost all to China, and its recorded leather exports are close to nil. Many goats are singed at slaughter so the skin is eaten; each skin flayed, salted and graded instead is raw material that tanners and exporters buy.814 Collection is the cheapest step to enter because it needs organisation more than plant.
02
Contract slaughter and cold chain. Only about four percent of implied slaughter passes formal inspection, and only a few Accra processors, such as Johnny’s Food and Meat Complex, deliver chilled goat meat to hotels, restaurants, caterers and supermarkets, at about GH¢130 a kilogram in September 2026. Supplying those processors and institutional kitchens with inspected carcasses is an opening for a slaughter-and-chill business34. Confirm spare capacity facility by facility first. The new municipal facilities, the Bilipiela meat shop and abattoir in Tamale, opened in December 2025, and the Jamestown multi-purpose abattoir in Accra, due for commissioning in September 2026, can sell contract slaughter and chilling to traders and processors.1011
03
Organised aggregation. The trader and broker layer earns well because it is the best-organised link. An aggregator who buys transparently, at published weights, competes on the one dimension the incumbent layer cannot match without giving up its information advantage. A permitted festive market with scales is a second opening: in May 2026 traders at Kanda in Accra said they sold on the roadside because the area has no designated livestock market like Ashaiman’s.25
04
The digital and AI angle. Traceability is the AI-adjacent opening here, and its precondition is a record. Livestock247 runs animal traceability at scale in Nigeria, and no equivalent service for goats and sheep has been reported in Ghana. Online selling already exists: Jiji Ghana carried 117 goat listings in September 2026, most priced between GH¢600 and GH¢3,500, a base for a marketplace that adds weights, health records and delivery.38 Start with tagged animals and a phone record at each hand-over: that alone answers the inspection and provenance question buyers are beginning to ask, and it creates the dataset any later matching or pricing model would need.
🐐 The risks that sit inside the chain 🐐
Uninspected slaughter and food safety
HIGH
What it is
The overwhelming majority of slaughter takes place outside licensed, inspected facilities, at backyard slabs with no veterinary inspection, traceability or recorded hygiene standard.
Evidence
Inspected slaughter in 2024 was 129,227 goats and 65,599 sheep18, against roughly 4.74 million head of estimated off-take from the ministry’s assumed 30 percent off-take rate, so on that estimate about 4 percent of slaughter is inspected, and hygiene and handling have been assessed as weak even at the licensed Kumasi facility30.
Who it hits
Consumers first, then any business selling into a channel that cares about provenance, since one traced food-safety incident closes a hotel or institutional contract permanently.
How to manage it, and the opening
Never buy carcass from an uninspected source for a formal channel. Contract slaughter at a licensed facility even when it costs more, and price the certificate into the sale rather than absorbing it. For a facility investor, the compliance cost is the moat.
Breeding females slaughtered pregnant
HIGH
What it is
The chain routinely consumes its own breeding capital, because pregnancy is not routinely checked at ante-mortem inspection, and the authors suggest pregnant females may fetch more because they look heavier.
Evidence
49.7 percent of does and 38.2 percent of ewes slaughtered at the Kumasi abattoir were pregnant, with 96.3 percent of the losses in mid pregnancy and the value forgone put at between about GH¢2.76 million and GH¢3.53 million a year at that one facility. The authors attribute the practice to the absence of routine pregnancy detection at ante-mortem examination and to sellers offering pregnant females because they present as weightier29.
Who it hits
The sector's growth rate, and any entrant trying to buy bred breeding stock, bidding against the meat trade for the same animal.
How to manage it, and the opening
Treat it as a supply opportunity and buy those females before they reach the knife. For a facility or regulator, introduce ante-mortem pregnancy screening with diversion rather than slaughter, a rule and a trained inspector, with little capital.
Trader concentration and market power
MEDIUM TO HIGH
What it is
A small number of high-frequency traders and brokers hold the information and relationships that set the terms on which every producer sells, none of which requires collusion to work.
Evidence
Eigenvector centralisation of 99.3 percent across West African livestock markets, indicating markets dominated by a few very large traders, and brokers visiting the Kumasi market 16.4 times on average across the panel against 1.6 for non-brokers22, a regional study covering 2013 to 2017 across six countries of which only the Kumasi rows are Ghana-located.
Who it hits
Every farm-gate seller, and any new entrant who assumes a better price offer is enough to win supply from an established relationship.
How to manage it, and the opening
Build countervailing volume. Aggregate enough animals to be worth a contract, publish your own weights and prices, and use brokers deliberately as a paid service.
Transport loss and informal levies
MEDIUM
What it is
Animals moving from the northern production zones to the southern markets travel long distances in vehicles that are frequently unfit, and the journey carries both physical loss and unofficial payments at checkpoints.
Evidence
Unofficial payments in transit average GH¢63.48 a batch, 1.13 percent of batch cost, alongside transport at GH¢404.47 and 7.20 percent1. A survey of 78 cattle transporters on the same corridor found journeys averaging 528 km and 18 hours, only about 40 percent of vehicles judged fit, and 52 percent of transporters paying levies to customs, police, assemblies and veterinary officers; the same study notes small ruminants riding on makeshift upper decks above cattle27. No verified loss rate exists for small ruminant transport in Ghana.
Who it hits
The trader most directly, but the cost is passed back to the farm-gate price, so the producer pays for it without seeing the line item.
How to manage it, and the opening
Measure it. Weigh a sample at loading and at arrival for twenty journeys and you will have a loss baseline to manage against. Then load below capacity, insist on a ramp, move at night in the hot season, and treat a documented loss rate as a selling point to any buyer paying for consistency.
🐐 Key takeaways 🐐
01
The chain is short: three to five stages between producer and consumer, with little value added, so most of the margin is earned on movement, storage and risk.
02
Power in this chain comes from frequency. Across the 2013 to 2017 panel a broker visited Kumasi 16.4 times on average against 1.6 for other traders, and a margin of about a quarter turned over two or three times a month is what the trade rests on.
03
On MoFA's own estimate, about 4 percent of Ghana's small ruminant off-take passes inspected slaughter, which helps explain the lack of traceability and food-safety assurance.
04
The chain eats its own breeding stock: half the does slaughtered at the Kumasi abattoir were pregnant.
05
The by-product branch loses value before any processing question arises: many skins are singed and eaten, recorded goatskin output nearly doubled to 2014 while export value halved, and Ghana's recorded exports of sheep and goat leather are close to nil.
Written for each reader
🐐 Practitioner intelligence 🐐
Hover any card to pause and lift it.
For students
Do not start by buying animals. Start at a slaughter slab: agree with two or three operators to take their goat and sheep skins, salt and grade them, and sell them on to the leather workers, and you are running a small business on the cost of salt, a shed and transport, while learning the slaughter trade from the inside. The mistake specific to goats and sheep is buying a batch at a live market and expecting to resell it profitably a week later, since the brokers you would compete with visit that market about ten times as often as other traders, have about fifteen years in the trade, and know what the animal is worth at the other end while you are guessing.
For entrepreneurs
Sign the buyer before you touch an animal. Buyers pay a premium only for quality they can verify, so your first asset is a customer who requires verification: one institutional buyer stating a specification and a volume, then contract slaughter at a licensed abattoir rather than building one, confirming spare capacity facility by facility, then a supply group of twenty to fifty keepers on a collection calendar, and only then cold storage. The trap is the festival, where an entrant who commits to supply rams for Eid buys whatever is available in the last fortnight from whoever has it, the one transaction here with no information, no bargaining power and no time to verify anything.
For investors
Little value is added between flock and plate in Ghanaian small ruminants, so the investable asset is a missing link rather than a larger share of an existing one, and returns come from being first to sell a verified product. Diligence specific to the value chain: ask where the animals are slaughtered and demand inspection records, since on MoFA's estimate about 96 percent of small ruminant off-take is not inspected, ask for the buyer contract before the facility drawings, since a processing asset without contracted offtake competes against a free informal alternative, and ask how many animals the business can deliver on a stated date, the one question the trader layer answers well. Structure the cheque in tranches against contracted volume delivered and inspected, and size the deal on customers compelled to buy formal.
For ecosystem actors
The best-evidenced lever is ante-mortem pregnancy screening at the licensed abattoirs, with diversion rather than slaughter of the pregnant females counted at Kumasi: it needs a directive and trained inspectors, with little capital. The second lever is a designated municipal livestock market where traders currently work the roadside, since the Kanda traders asked for exactly that, and the public-money failure to avoid is building an abattoir or cold store without securing the buyers who would require it, since a formal facility competing on price against an uninspected slab usually loses; the new public abattoirs in Tamale and Accra will need contracted buyers to stay busy. Fund enforcement and buyer contracts before buildings.
For students
Do not start by buying animals. Start at a slaughter slab: agree with two or three operators to take their goat and sheep skins, salt and grade them, and sell them on to the leather workers, and you are running a small business on the cost of salt, a shed and transport, while learning the slaughter trade from the inside. The mistake specific to goats and sheep is buying a batch at a live market and expecting to resell it profitably a week later, since the brokers you would compete with visit that market about ten times as often as other traders, have about fifteen years in the trade, and know what the animal is worth at the other end while you are guessing.
For entrepreneurs
Sign the buyer before you touch an animal. Buyers pay a premium only for quality they can verify, so your first asset is a customer who requires verification: one institutional buyer stating a specification and a volume, then contract slaughter at a licensed abattoir rather than building one, confirming spare capacity facility by facility, then a supply group of twenty to fifty keepers on a collection calendar, and only then cold storage. The trap is the festival, where an entrant who commits to supply rams for Eid buys whatever is available in the last fortnight from whoever has it, the one transaction here with no information, no bargaining power and no time to verify anything.
For investors
Little value is added between flock and plate in Ghanaian small ruminants, so the investable asset is a missing link rather than a larger share of an existing one, and returns come from being first to sell a verified product. Diligence specific to the value chain: ask where the animals are slaughtered and demand inspection records, since on MoFA's estimate about 96 percent of small ruminant off-take is not inspected, ask for the buyer contract before the facility drawings, since a processing asset without contracted offtake competes against a free informal alternative, and ask how many animals the business can deliver on a stated date, the one question the trader layer answers well. Structure the cheque in tranches against contracted volume delivered and inspected, and size the deal on customers compelled to buy formal.
For ecosystem actors
The best-evidenced lever is ante-mortem pregnancy screening at the licensed abattoirs, with diversion rather than slaughter of the pregnant females counted at Kumasi: it needs a directive and trained inspectors, with little capital. The second lever is a designated municipal livestock market where traders currently work the roadside, since the Kanda traders asked for exactly that, and the public-money failure to avoid is building an abattoir or cold store without securing the buyers who would require it, since a formal facility competing on price against an uninspected slab usually loses; the new public abattoirs in Tamale and Accra will need contracted buyers to stay busy. Fund enforcement and buyer contracts before buildings.
Where this connects.The multiplication gap that leaves this chain with few commercial sources of breeding stock is Pillar 1’s subject, and it is the reason the pregnant-female opening faces little competition. The demand calendar and the festive price behaviour that make the live trade worth what it is, including the 2026 divergence between Accra and Kumasi prices under the same Sahel export bans, belong to Pillar 2. And the cost model, the sensitivity analysis and the cost-cutting levers that turn any of the openings ranked above into a budget are built in Pillar 5, which is where the margin figures used here are converted into an enterprise.
Footnotes
Kassoh, Fallah Samuel, Kwasi Ohene-Yankara, Fred Nimoh, Ibrahim Latif Apaassongo, and Raymond Manna Bangura. "Market Performance of Small Ruminant in Kumasi and Tamale of Ghana." American Journal of Economics 11, no. 3 (2021): 84-94. http://article.sapub.org/10.5923.j.economics.20211103.02.html.↑
Yenibehit, Nanii. "Market Integration and Price Transmission Analysis of Foreign and Ghanaian Beef and Mutton Markets; the Effect of Crude Oil Price and Exchange Rate Fluctuations." Cogent Food and Agriculture 9, no. 2 (2023): 2260611. https://doi.org/10.1080/23311932.2023.2260611.↑
Johnny's Food and Meat Complex (JFAMCO). "Home Page." JFAMCO, Madina, Accra, n.d., accessed 29 September 2026. https://jfamco.com/.↑
Nuvey, Francis Sena, Gloria Ivy Mensah, Jakob Zinsstag, Jan Hattendorf, Günther Fink, Bassirou Bonfoh, and Kennedy Kwasi Addo. "Management of Diseases in a Ruminant Livestock Production System: A Participatory Appraisal of the Performance of Veterinary Services Delivery, and Utilization in Ghana." BMC Veterinary Research 19 (2023): 237. https://doi.org/10.1186/s12917-023-03793-z.↑
United Nations Statistics Division. UN Comtrade Database: Ghana (Reporter 288), Imports and Exports by Partner of Live Sheep (HS 010410), Live Goats (HS 010420), Sheep and Goat Meat (HS 0204), Other Raw Skins (HS 410390) and Sheep and Goat Leather (HS 4105, 4106, 4112), 2022-2025. New York: United Nations, 2026. https://comtradeplus.un.org/.↑
Mascianà, Patrizia. World Statistical Compendium for Raw Hides and Skins, Leather and Leather Footwear 1998-2014. Rome: Food and Agriculture Organization of the United Nations, 2015. https://www.fao.org/3/i4651e/i4651e.pdf.↑
Abdulai, Prosper Manu, Chika Ossai, Anthoneth Ndidi Ezejiofor, Chiara Frazzoli, Joaquim Rovira, Osazuwa Clinton Ekhator, Caleb Kesse Firempong, and Orish Ebere Orisakwe. "Polycyclic Aromatic Hydrocarbons Burden of Meats Singed with Different Fuel Sources from Abattoirs in Ghana and Associated Cancer Risk Assessment." Environmental Health Insights 19 (2025): 11786302241310842. https://doi.org/10.1177/11786302241310842.↑
Ofori, S. A., and J. K. Hagan. "Characteristics and Trait Preferences of West African Dwarf Goat Keepers in Ghana." Tropical Animal Health and Production 53, no. 3 (2021): 356. https://doi.org/10.1007/s11250-021-02781-5.↑
Adams, Faizal, Kwasi Ohene-Yankyera, Robert Aidoo, and Camillus Abawiera Wongnaa. "Economic Benefits of Livestock Management in Ghana." Agricultural and Food Economics 9 (2021): 17. https://doi.org/10.1186/s40100-021-00191-7.↑
United Nations Statistics Division. UN Comtrade Database: Ghana, Imports of Live Sheep and Goats (HS 0104) and Sheep and Goat Meat (HS 0204), 2021-2023. New York: United Nations, 2026. https://comtradeplus.un.org/.↑
Mogre, J. W. S., F. Adzitey, G. A. Teye, and P. T. Birteeb. "Cattle Transporters' Attitudes, Indigenous Knowledge, and Current Practices towards Animal Welfare, Occupational Well-Being, and Operational Challenges: A Survey of Five Regions in Ghana." Heliyon 10, no. 6 (2024): e27317. https://doi.org/10.1016/j.heliyon.2024.e27317.↑
Awafo, Edward A., and Joshua Amenorfe. "Techno-Economic Studies of an Industrial Biogas Plant to Be Implemented at Kumasi Abattoir in Ghana." Scientific African 11 (2021): e00712. https://doi.org/10.1016/j.sciaf.2021.e00712.↑
Mohammed, Alhassan, and Kwame Anane. "Prevelence and Economic Inference of Small Ruminant Foetal Wastage at the Kumasi Abattoir Ltd (Kaase)." Asia Pacific Journal of Sustainable Agriculture, Food and Energy 10, no. 1 (2022): 28-33. https://doi.org/10.36782/apjsafe.v10i1.105.↑
Frimpong, Samuel, Girma Gebresenbet, Techane Bosona, Emanuel Bobobee, Elias Aklaku, and Ibrahim Hamdu. "Animal Supply and Logistics Activities of Abattoir Chain in Developing Countries: The Case of Kumasi Abattoir, Ghana." Journal of Service Science and Management 5, no. 1 (2012): 20-27. https://doi.org/10.4236/jssm.2012.51003.↑
Appiah-Brempong, Miriam, Helen M. K. Essandoh, Nana Yaw Asiedu, Samuel Kwame Dadzie, and Francis Warings Yao Momade. "An Insight into Artisanal Leather Making in Ghana." Journal of Leather Science and Engineering 2 (2020): 25. https://doi.org/10.1186/s42825-020-00039-8.↑