Ghana Agribusiness PlaybookMarine Fisheries
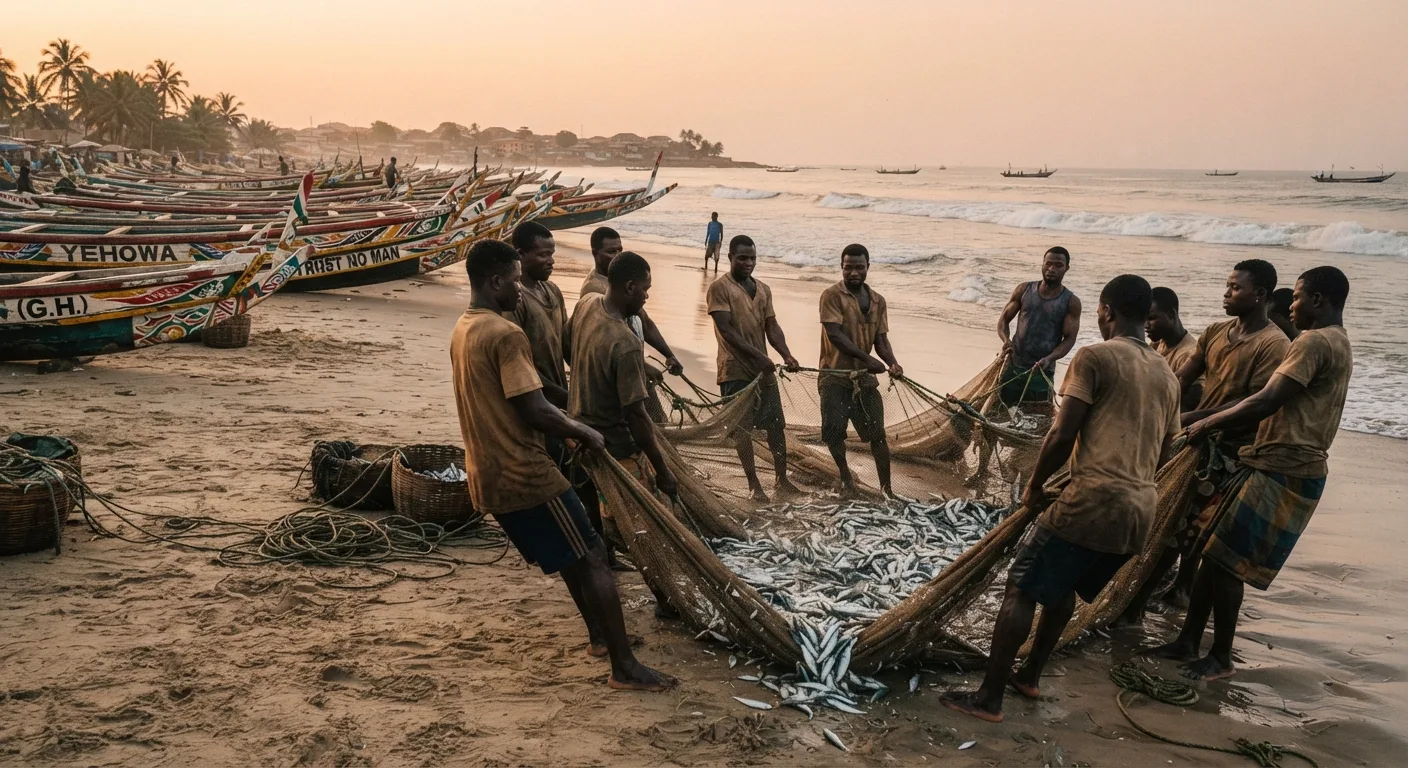
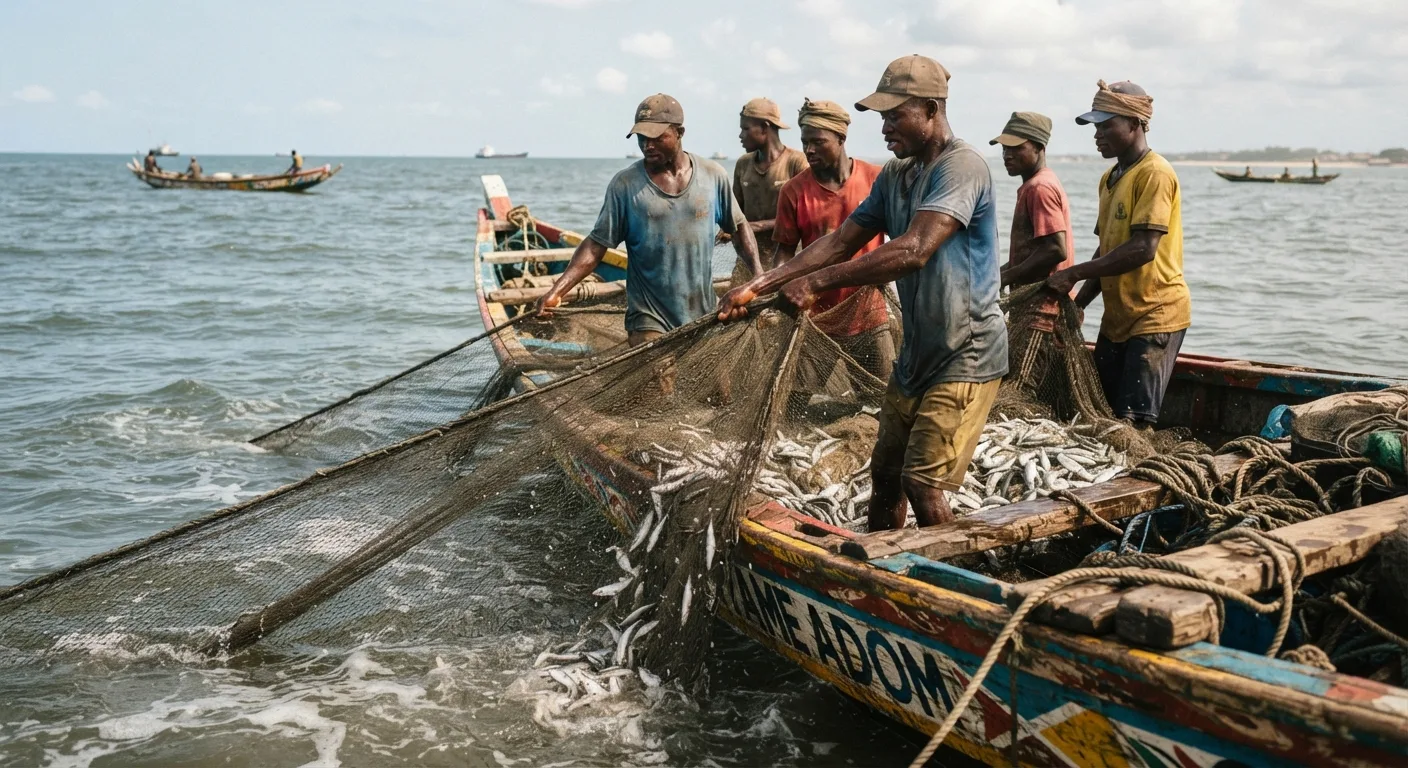
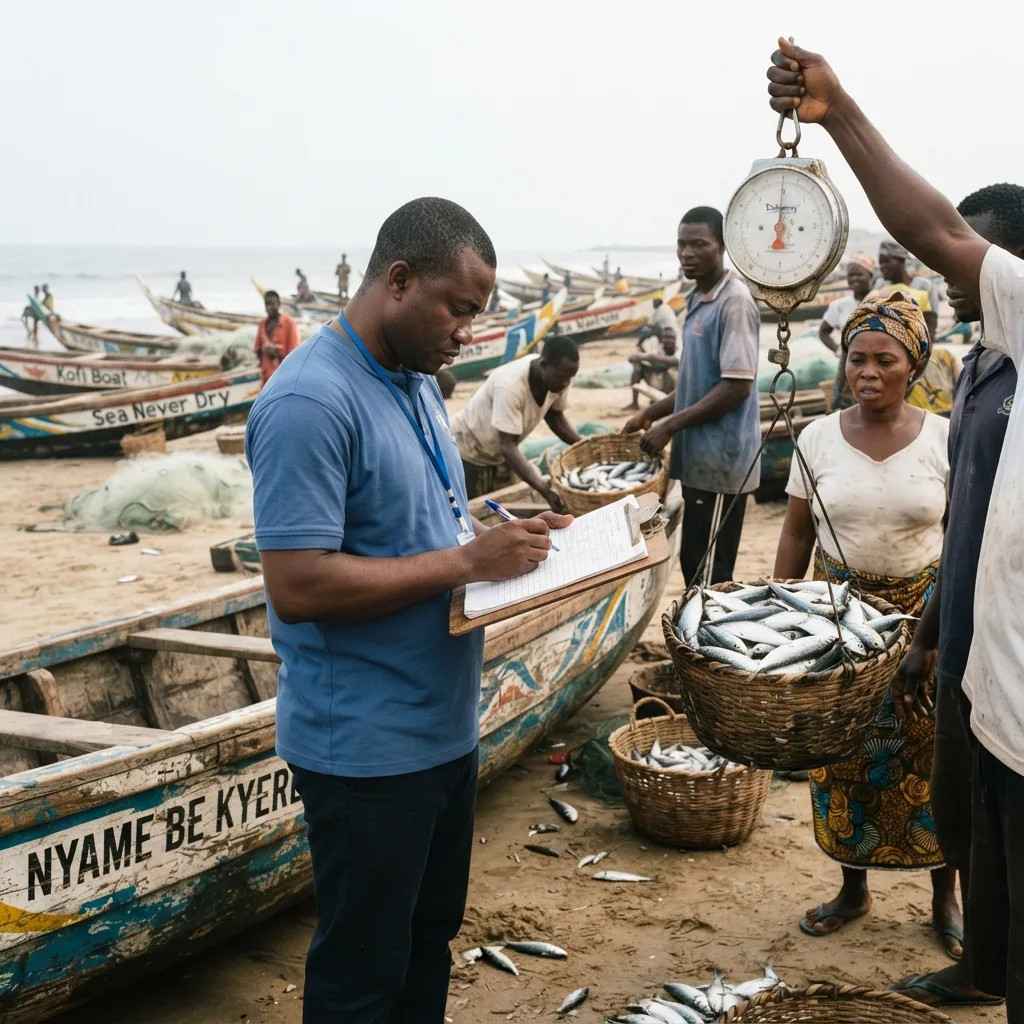
Ghanaian canoes landing small pelagic fish at dawn, a purse-seine net coming ashore
Marine Fisheries · Pillar 01

Species and Stocks

Ghana has two marine fisheries in opposite conditions, and the first commercial decision is knowing which one you are in. Seventy per cent of the 425,424 tonnes landed in 2023 were small pelagics overfished since 2004; the sound 28.5 per cent is tuna.
Species and stocks · Pillar 01

Ghana has two marine fisheries in opposite conditions, and the first commercial decision here is knowing which one you are in. One feeds the country and is failing; the other earns the foreign exchange and is sound. Neither can be made bigger by any operator: the input is a shared stock with a ceiling, and for most of what Ghana eats that ceiling passed twenty years ago.

A line of painted wooden canoes drawn up on a Ghanaian beach at first light, crew hauling a purse-seine net of small pelagic fish ashore, documentary photograph
Two fisheries, one sea
The first decision: which fishery a proposal actually sits in.
425,424 t
marine fish landed in 2023, worth GH¢9.82 billion
70%
of landings are small pelagics, the fishery that is failing
28.5%
of landings are tuna, the only healthy stocks

🐟 Two fisheries, one sea 🐟

Treat this as one industry and the business case fails. Ghana landed 425,423.91 tonnes of marine fish1, worth GH¢9.82 billion, split artisanal canoes 54.3 per cent, tuna 28.5, industrial trawl 12.5 and semi-industrial 4.7, recomputed against the Commission’s own stated total2; the canoe fleet lands and earns the most, GH¢4.61 billion.

Table 2: Ghana's two marine fisheries, side by side
The small pelagic fisheryThe tuna fishery
What it isSardinella, anchovy, chub mackerel, taken close inshoreYellowfin, skipjack and bigeye, taken offshore
Who catches it11,583 canoes at the 2016 census, 12,175 in the preliminary 2022 surveyAn industrial fleet of purse seiners and pole-and-line vessels
Where it goesThe domestic plate, mostly smokedCanning at Tema, mostly for EU export
Share by weightAbout 70 per cent of landings, 2015 to 2020 average28.5 per cent of landings in 2023
Share by valueGH¢4.61 billion in 2023, the largest in total34.6 per cent of landed value, the highest per tonne
Stock conditionEvery assessed stock overfished and still being overfishedAll three stocks neither overfished nor subject to overfishing
The commercial questionHow to lose less of what is already landedHow to hold market access, and how long the bait lasts

Sources: Fisheries Commission (2023); Lazar et al. (2020); Cook et al. (2021); International Commission for the Conservation of Atlantic Tunas (2025); Fisheries Commission, Dovlo et al. (2016); Ashitey (2019) for the canning and export destination.

What this means.A proposal that says “Ghanaian fish” has not yet said anything bankable. The two fisheries carry different customers, capital and resource outlooks, so the due-diligence question gives opposite answers depending on which is in front of you. Settle that before market sizing.

🐟 The small pelagics: the fishery that feeds the country, and is failing 🐟

Small pelagics are the protein floor of Ghanaian diets, at about 70 per cent of total marine landings3, cheap and, once smoked, storable without the refrigeration this chain largely lacks. Fish overall supplies between 50 and 80 per cent of the animal protein Ghanaians eat, with pelagic fish 71 per cent of total fish intake4.

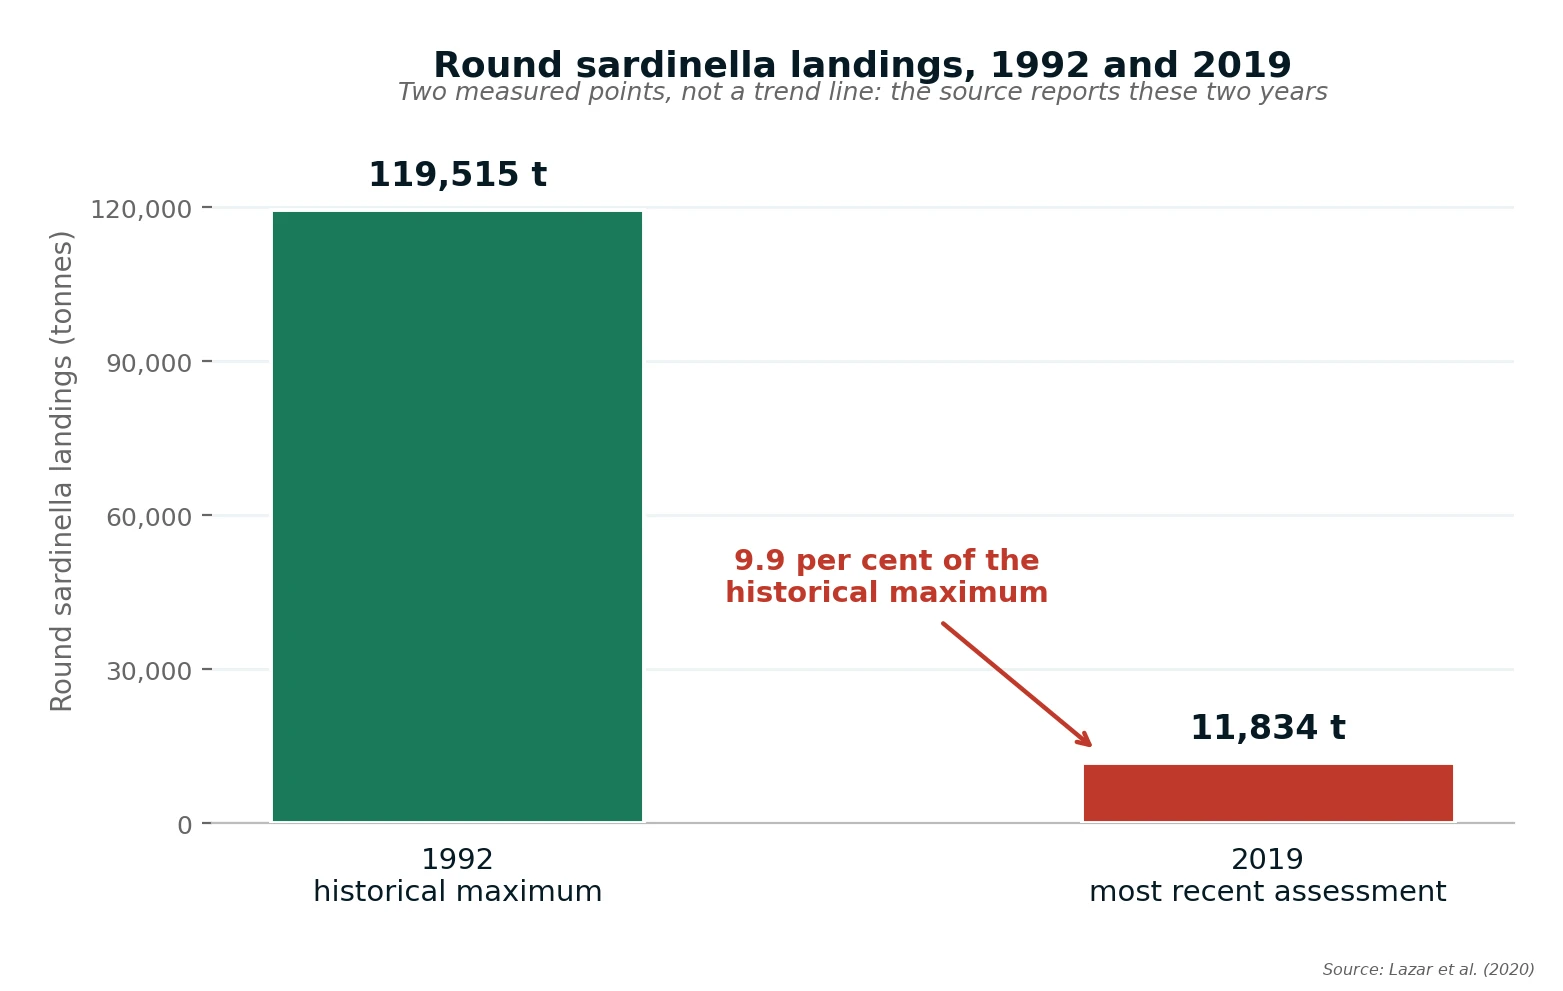
Round sardinella landings fell from 119,515 tonnes in 1992 to 11,834 tonnes in 2019, 9.9 per cent of the historical maximum5. The stock has sat in the overfished and still overfishing quadrant continuously since 20046. The latest puts it at 54 per cent of the biomass that would support maximum sustainable yield7, against a healthy 300,000 tonnes, and the fleet applies a fishing mortality of 0.81 against a sustainable 0.4, removing about 65 per cent of the stock every year8.

Round sardinella landings against the stock's historical maximum, 1992 to 2019
Figure 1 Round sardinella landings against the stock’s historical maximum, 1992 to 2019
What this shows

Two measured points, not a trend. The source reports 1992 and 2019 and nothing between, so no line is drawn: the gap is 27 years nobody surveyed. Read it against the assessment verdict rather than as a slope, because a stock can fall and flatten and still be in the red on both measures, which this one has been every year since 2004.

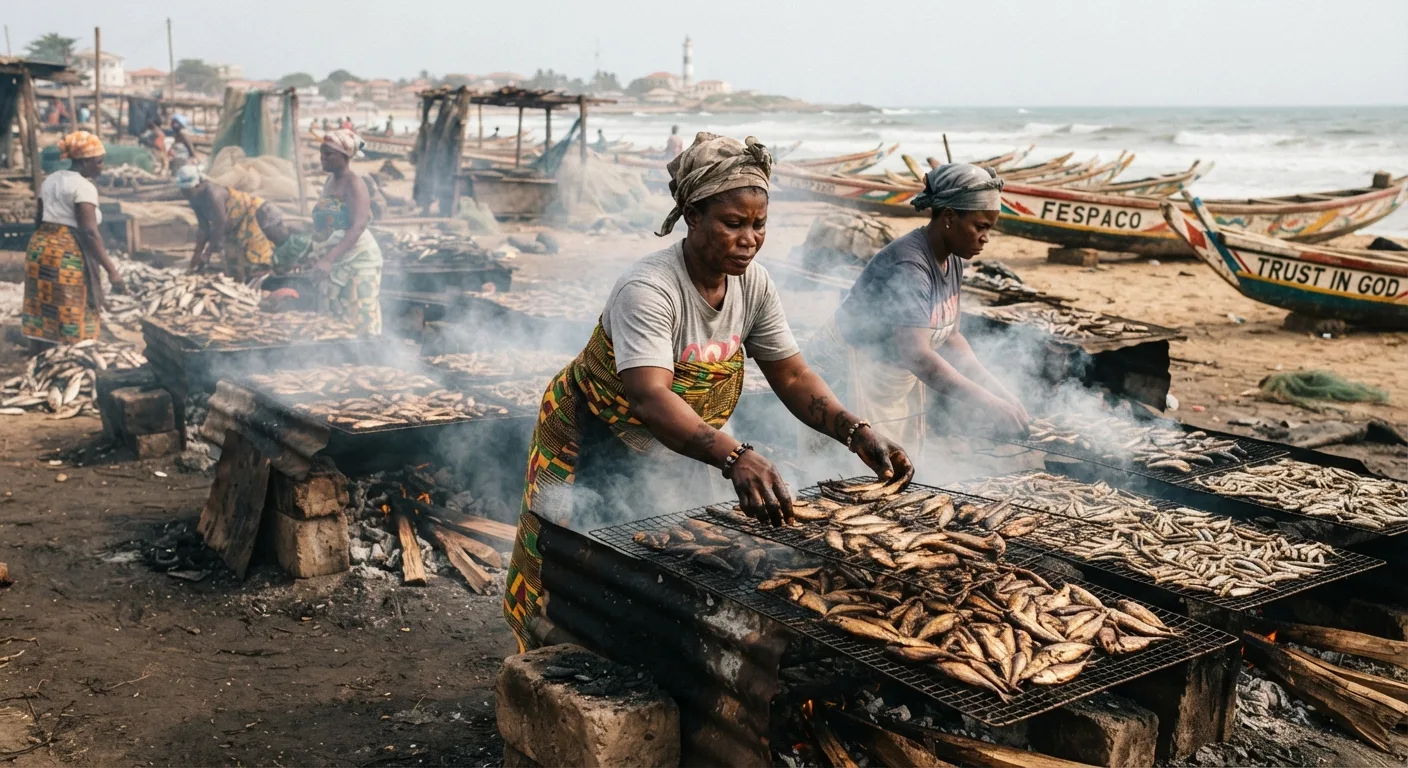
Women smoking small pelagic fish over traditional ovens at a Ghanaian landing beach, racks of round sardinella and anchovy, documentary photograph
The protein floor
Cheap and storable: the fishery feeding the country, once smoked.
9.9%
of its historical maximum: round sardinella's 2019 landing
0.81 vs 0.4
fishing mortality applied against the sustainable rate
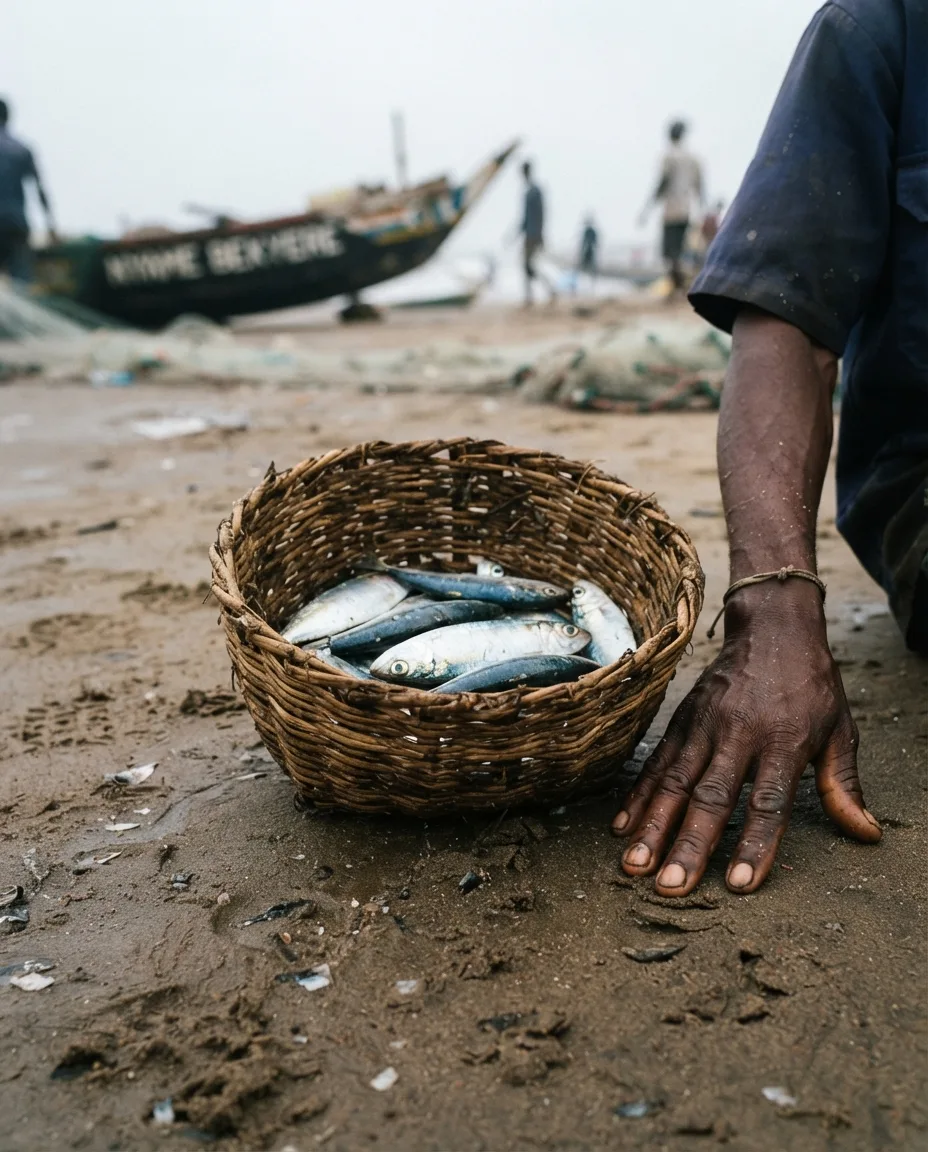
A small woven basket holding a thin catch of round sardinella on wet sand at a Ghanaian landing beach, a fisherman's hand resting beside it
A thin catch
What 9.9 per cent of the historical maximum looks like in a basket.

What ‘overfished’ costs the person in the canoe

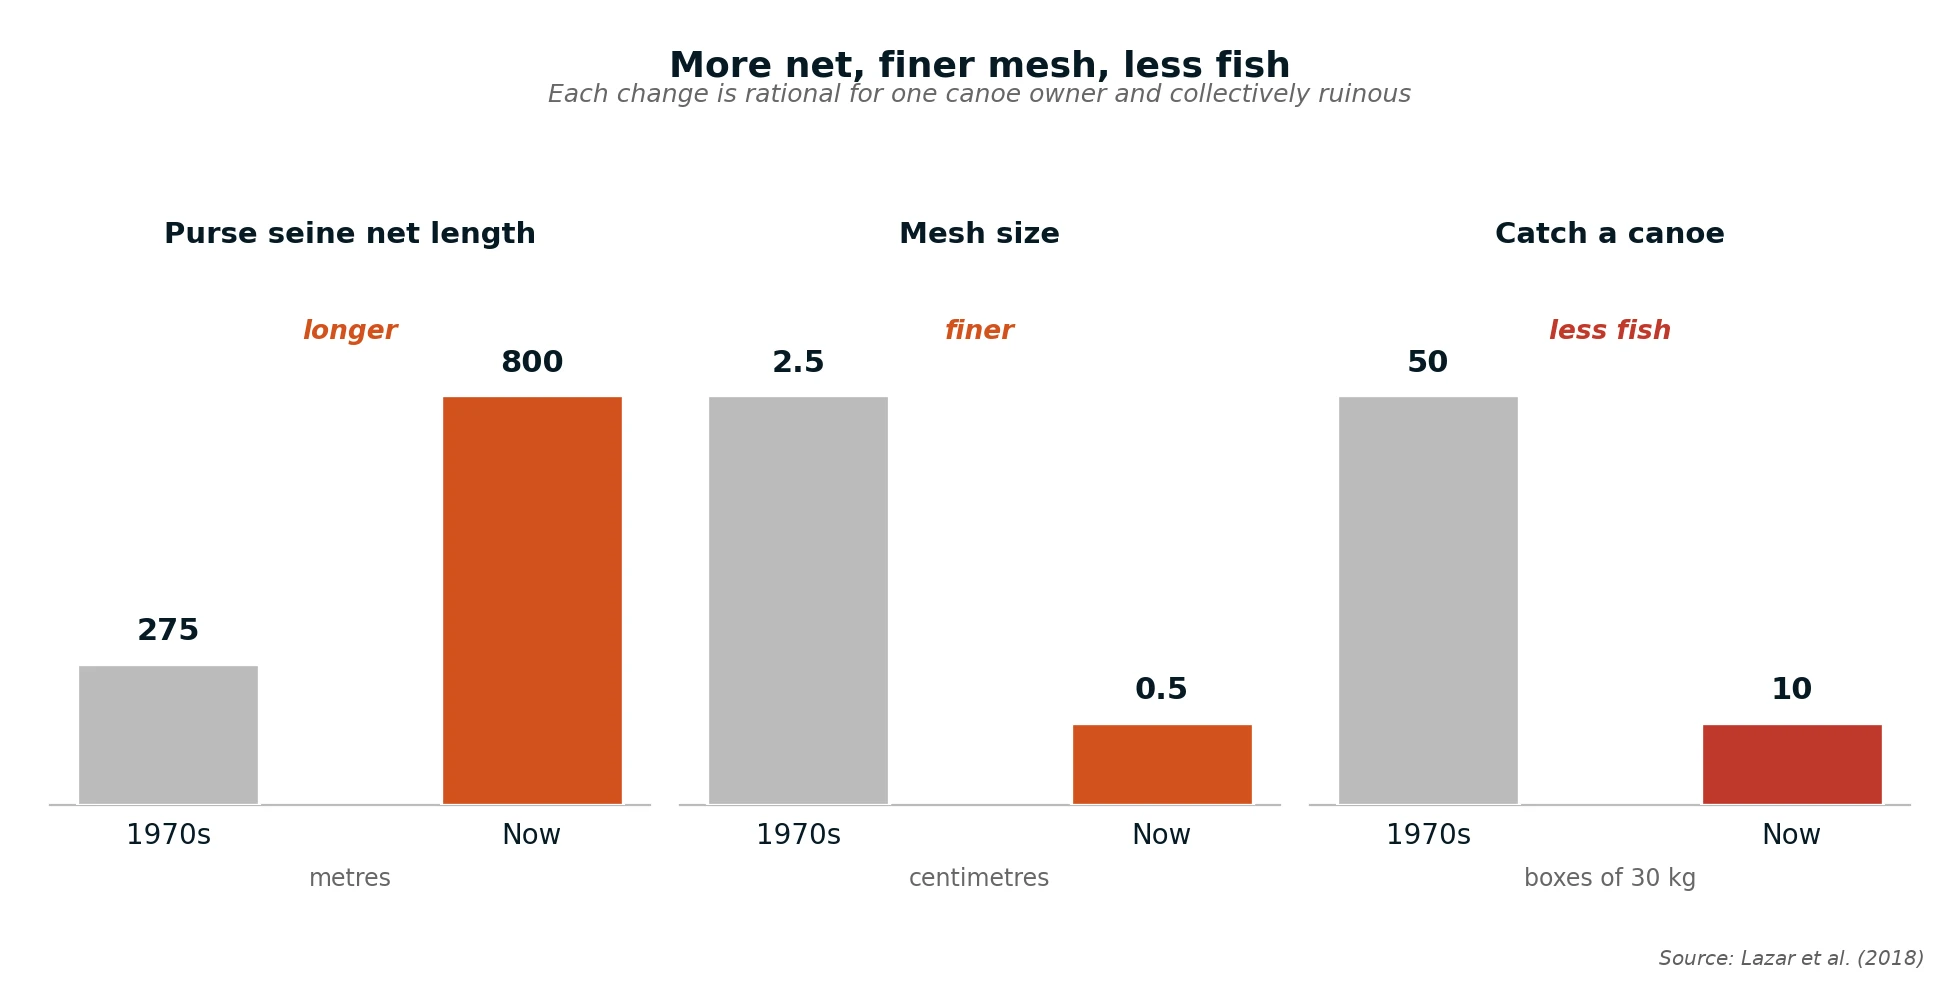
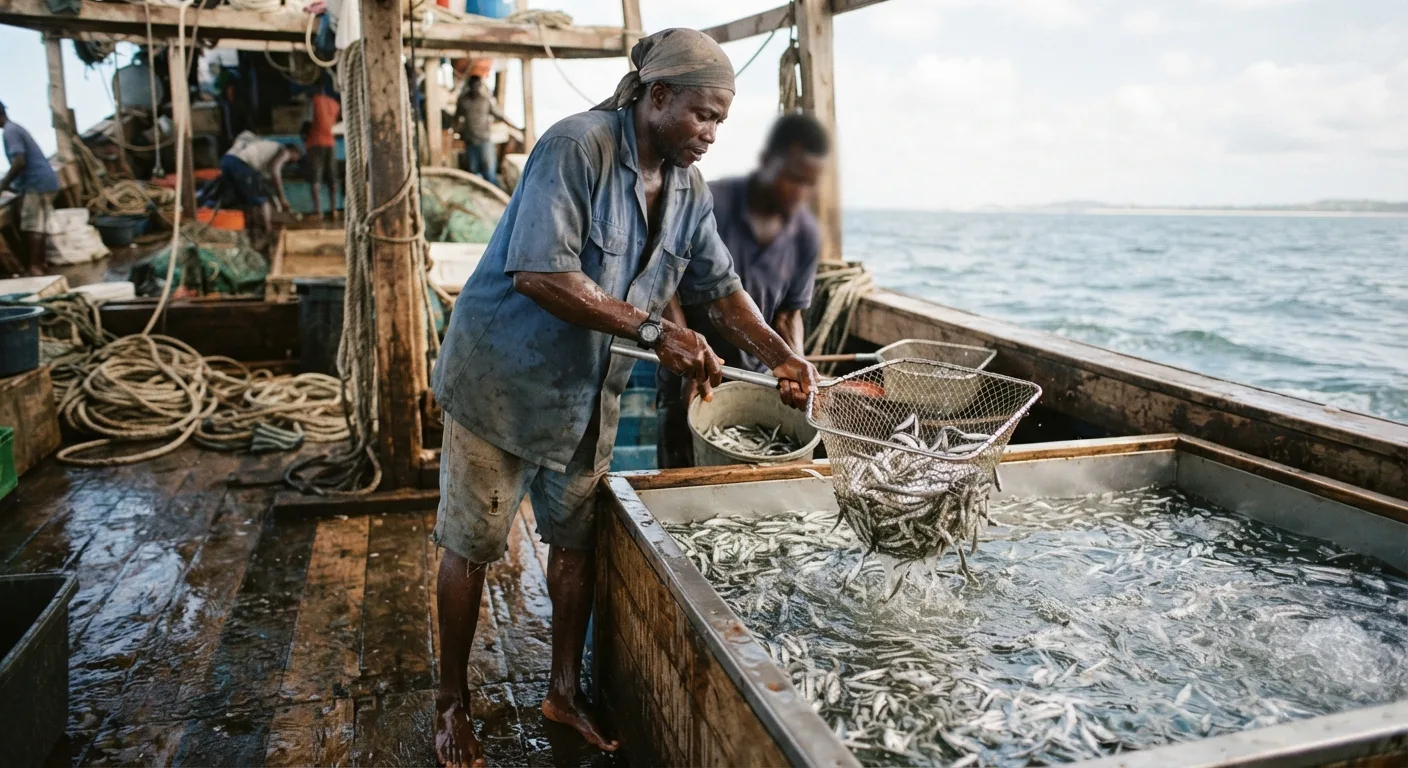
The operator meets a falling return on unchanged effort: catch fell to 454 kg a trip, down from 626 kg a year earlier9, a 27 per cent drop while costs held. Effort keeps rising, purse seine nets grew from 275 metres in the 1970s to 800 metres and mesh fell from 2.5 cm to 0.5 cm, while the catch a canoe fell from 50 boxes to 1010 under open access.

Purse seine net length rising, mesh size falling, and catch a canoe falling, since the 1970s
Figure 2 More net, finer mesh, less fish: purse seine gear and catch a canoe since the 1970s

Every one of these three movements is the right decision for one canoe owner and the wrong one for all of them together. A longer net with a finer mesh takes more of a shrinking stock today, including the juveniles that would have been next year’s catch, which is why the third panel falls as the first two rise. No operator can buy their way out of this with better gear.

Read this before planning a catching business. No viable business here begins with catching more small pelagic fish: the stock cannot supply it and the law is moving against the gear that would try. Every small pelagic opportunity sits after the landing, in losing less, grading, chilling, smoking cleanly and selling to someone who pays more. A shrinking raw supply raises the value of every point of loss recovered (Pillars 5 and 6).

A Ghanaian purse-seine crew hauling a long, fine-mesh net over the gunwale of a canoe, few fish visible in the catch, documentary photograph
454 kg
catch a trip, down from 626 kg a year earlier
50 to 10
boxes landed a canoe as gear intensified

🐟 The tuna: the only healthy stocks in Ghanaian waters 🐟

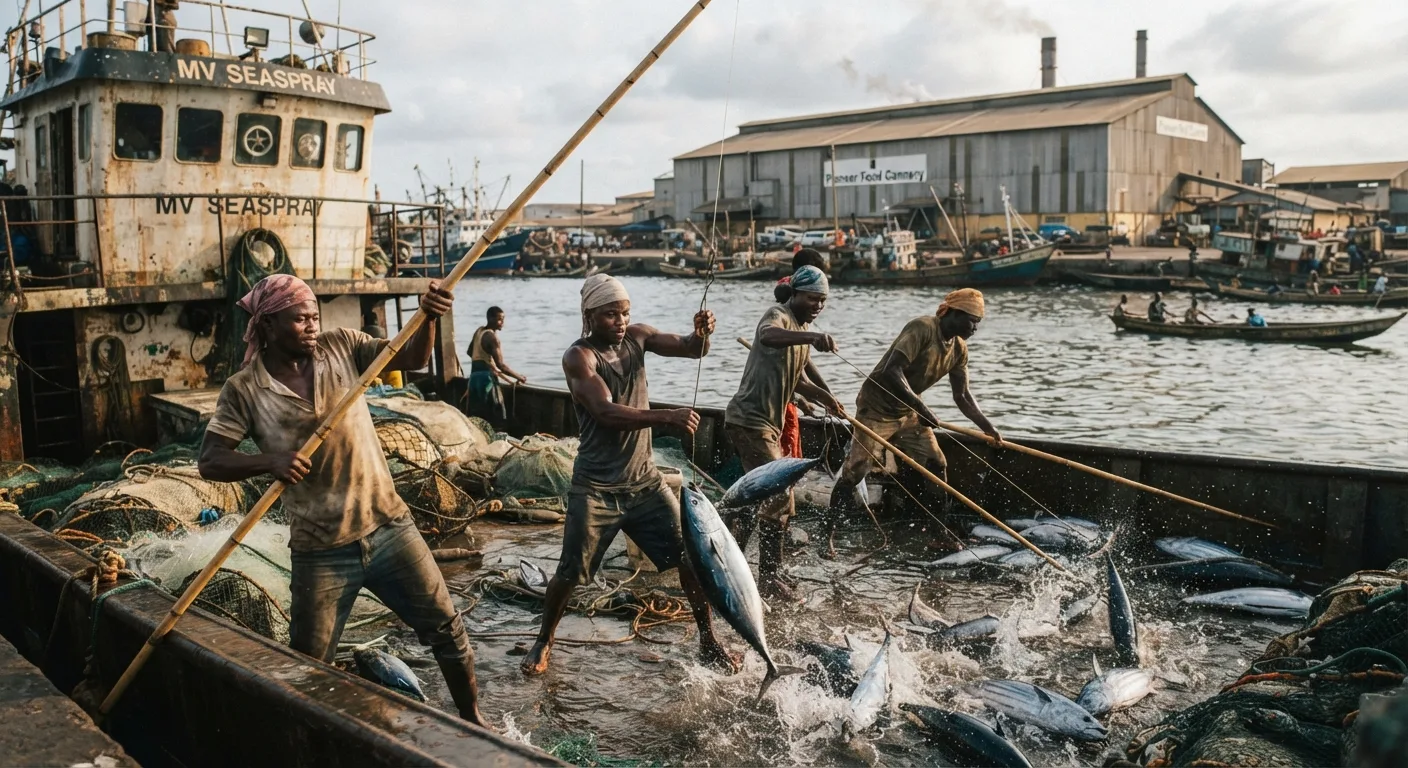
An industrial pole-and-line tuna vessel at Tema harbour, crew hauling skipjack tuna aboard, canning factory in the background, documentary photograph
The export earner
Sound and certified: the only stocks in good standing.
121,297 t
tuna landed, worth GH¢3.40 billion
34.6%
of landed value from 28.5% of landings by weight

Tuna earns the sector’s foreign exchange. Ghana landed 121,297 tonnes worth GH¢3.40 billion11, made up of skipjack 81,937 tonnes, yellowfin 29,875 tonnes, bigeye 3,349 tonnes and 6,136 tonnes of other tuna and tuna-like species12. Tuna is 28.5 per cent of landings by weight but 34.6 per cent by value13. It carries the export account, taken up in Pillar 2.

Assessed by the international commission for Atlantic tunas, 2022 to 2025: yellowfin is neither overfished nor subject to overfishing, at a maximum sustainable yield of 121,661 tonnes14. Skipjack and bigeye likewise, the only assessed stocks in good standing.

The link nobody prices: the healthy fishery runs on the sick one

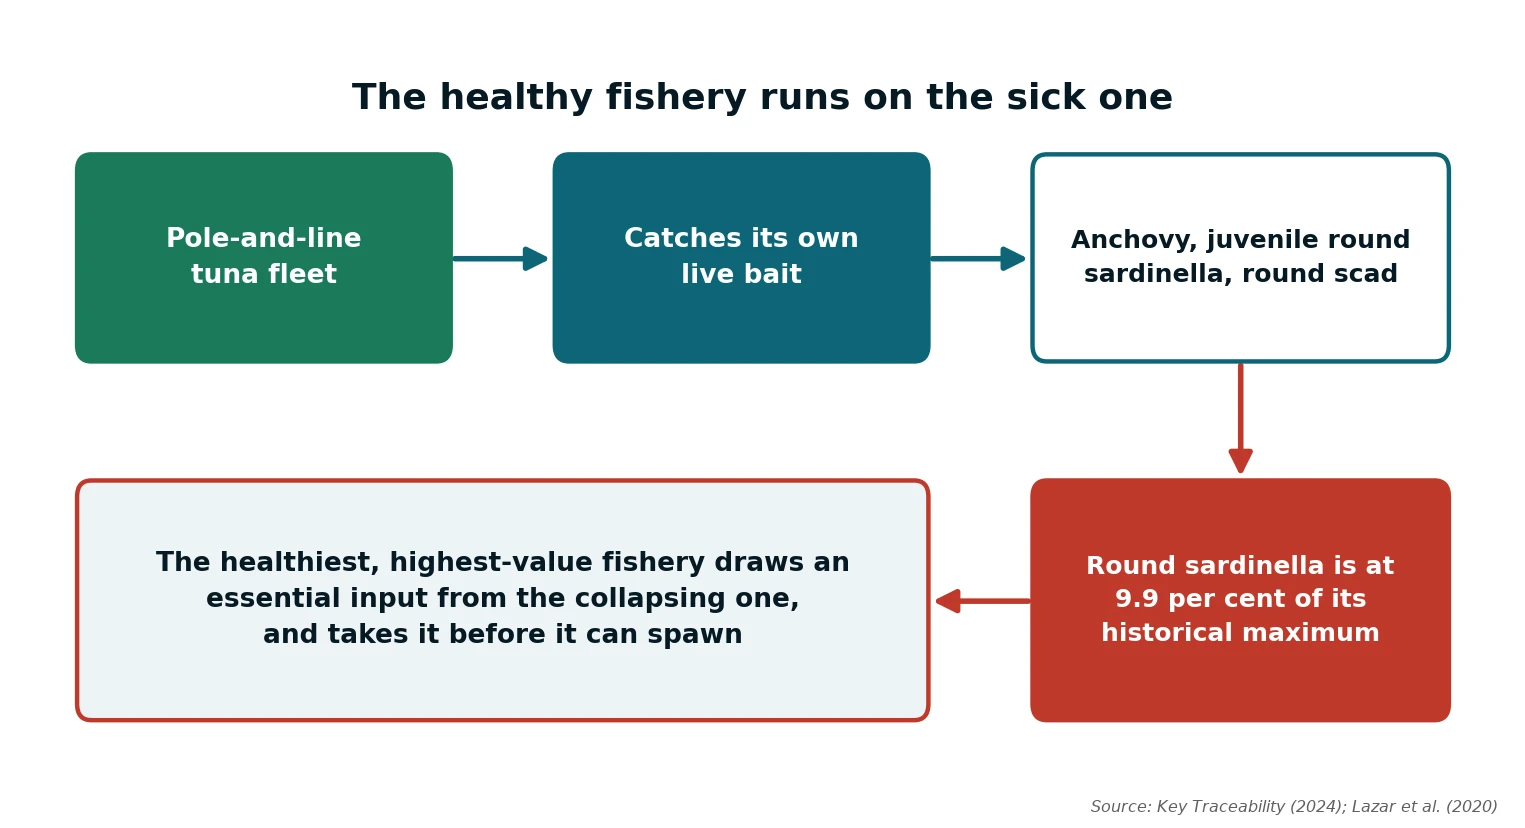
The two fisheries are commercially separate but biologically linked: underwriting the profitable one exposes you to the health of the other. The pole-and-line tuna fleet catches its own live bait, and that bait is anchovy, juvenile round sardinella and round scad15. Round sardinella, near a tenth of its historical maximum, is taken before it can spawn. The last survey put the whole pelagic resource at a total pelagic biomass of 67,553 tonnes, of which anchovies 18,372 tonnes and sardinellas only 7,398 tonnes16.

The bait fishery’s document calls the three species all abundant in Ghanaian coastal waters because of the local upwelling17, and anchovy is the one stock of the five where two assessments disagree outright, one placing it below the biomass for maximum sustainable yield and a second, by the regional fishery body, placing it above18. The defensible version is the sardinella half, where both assessments agree the stock is depleted and the fleet takes unspawned fish.

Diagram: how the pole-and-line tuna fishery depends on a collapsing small pelagic bait stock
Figure 3 How the tuna fishery depends on a collapsing small pelagic stock
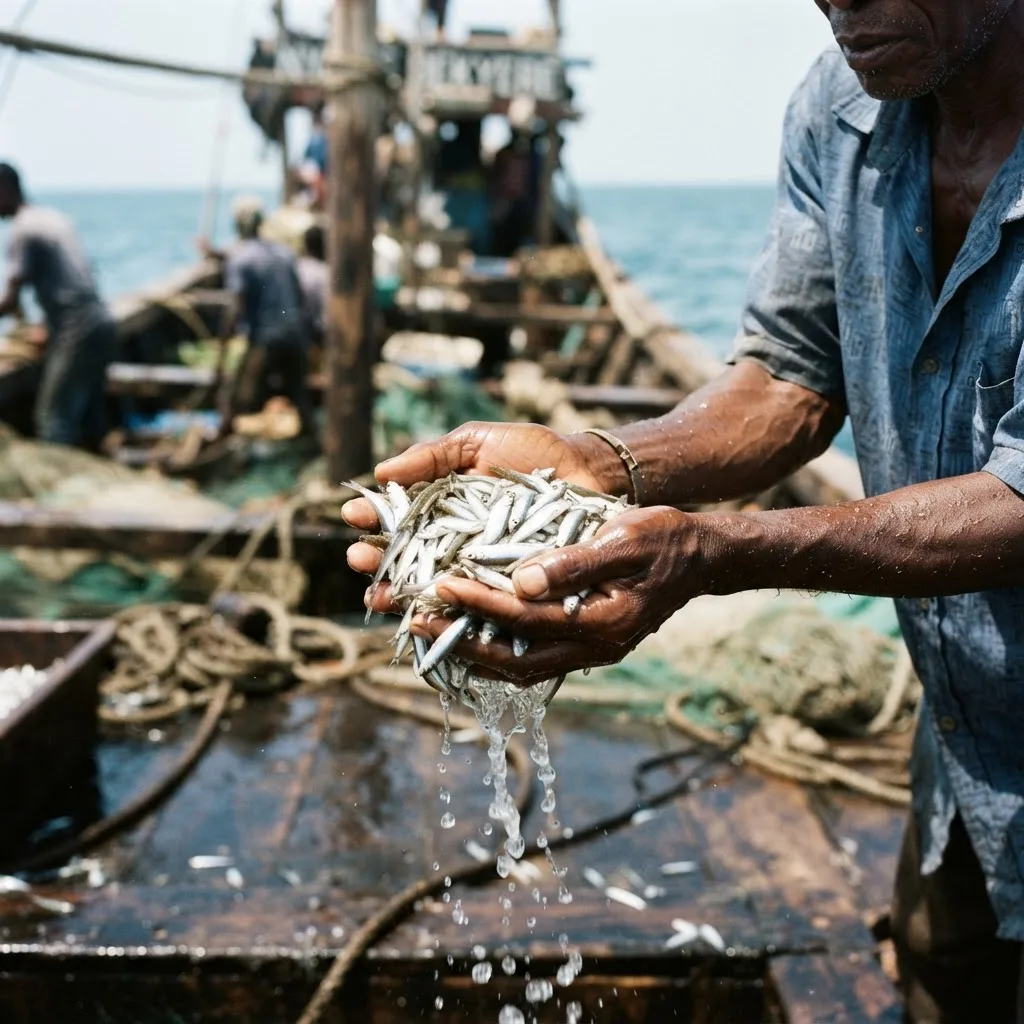
A pole-and-line crew member scooping small live anchovy and juvenile sardinella bait from a live-bait tank aboard a tuna vessel, documentary photograph
What this shows

The arrow that matters runs right to left along the bottom. Pole-and-line is normally the sustainability story a European buyer pays a premium for, and it is precisely that method which ties the fleet to a depleted stock and to its juveniles. The dependency is documented inside the fishery’s own management strategy and absent from the national plans governing the stock it draws on.

In January 2026 this became fact, with the certification of Ghana’s Atlantic skipjack and yellowfin tuna fisheries to the Marine Stewardship Council standard, covering both the purse seine and the pole-and-line fleets19. Its announcement does not mention the bait supply.

The risk that is in neither fishery’s plan, nor in the certification.The fishery’s own management strategy addresses its bait. The risk is unpriced: documented inside the fishery, but absent from the national plans that govern the stock it draws on and the certification a buyer sits behind. Pole-and-line earns its premium by being selective and low in bycatch, tying the fleet to the same depleted stock and its juveniles. Falling bait would raise costs and force a change of method, taking the certification down with it. Ask any tuna processing investment for its bait composition and cost trend, and read it against the sardinella assessment, not the anchovy.

🐟 What nobody knows, and why that is a commercial fact 🐟

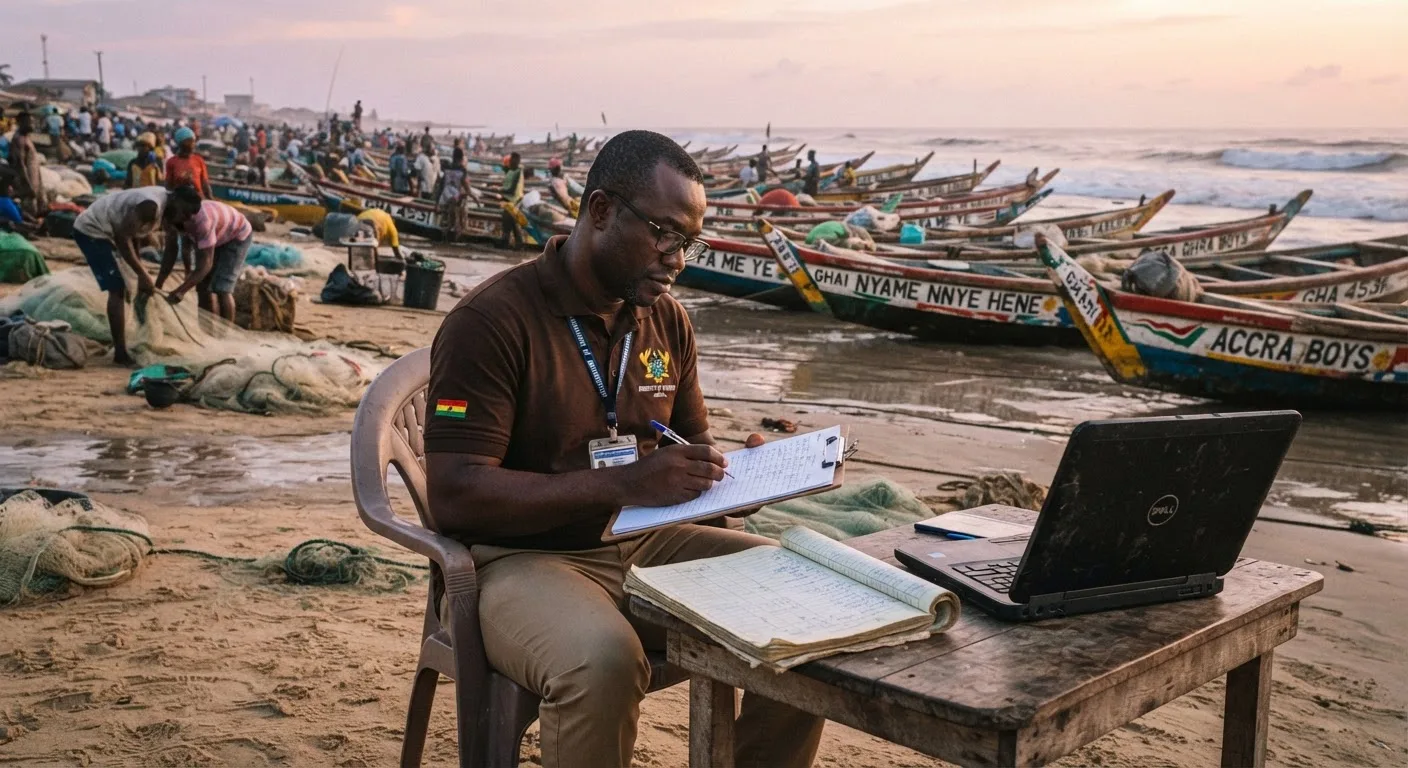
No annual production survey, current price series or recent census of producers exists. The last census found 11,583 canoes, 107,518 fishermen and 292 landing beaches in 186 villages, counted on the beach20, and the Commission has since published preliminary results from the 2022 Canoe Frame Survey, which put operational marine canoes at 12,175 against 11,583 in 201621. Registers report 13,700 canoes registered and 10,661 embossed22, but a register counts paperwork, not boats.

No assessment uses data newer than 2019, so every stock figure here is at least seven years old. Behind that sits Ghana has not owned a fisheries research vessel for about two decades, and every survey in that period was run from a foreign vessel23; there was no formally designated marine protected area anywhere in the exclusive economic zone as at March 202524. Ghana declared its first in April 2026, taken up in Pillar 3. Ghana holds 227,500 square kilometres of exclusive economic zone25, and nearly all fishing happens over the narrower continental shelf.

Action points. Date every fleet, catch and stock number in a model and show the vintage on the page, because most figures in this sector are a 2016 census or a 2019 survey wearing a current date. Price the cost of finding out independently before committing capital: a landing-site count, a season of catch records from the canoes you intend to buy from, and your own size sampling. The field questionnaire accompanying this playbook is built to collect exactly that: the only current data anyone here will hold.

A fisheries officer with a clipboard counting canoes on a crowded Ghanaian landing beach at dawn, a decade-old survey ledger beside a laptop, documentary photograph
2016
the year of the last full canoe census
2019
the newest data behind any stock assessment here

🐟 The risks that sit inside the resource itself 🐟

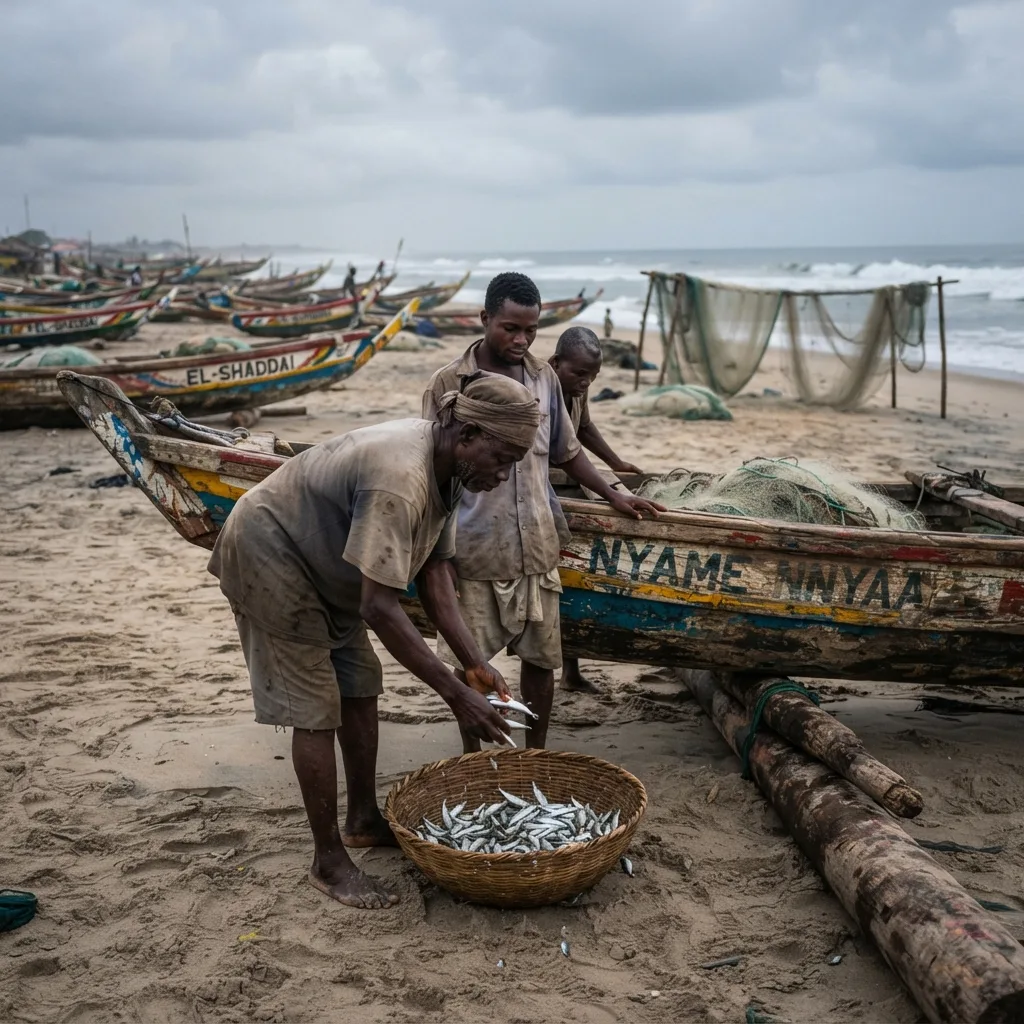
Fishermen sorting a small basket of small pelagic fish beside a beached canoe, a thin catch against the boats and empty nets behind

Building a business on a stock that is still falling

VERY HIGH
What it is

The small pelagic stocks supplying most of Ghana's domestic fish sit below the biomass for maximum sustainable yield and have been fished above the sustainable rate since 2004. Volume to any buyer is neither stable nor rising.

Evidence

Round sardinella landings fell from 119,515 tonnes in 1992 to 11,834 tonnes in 2019, and the fleet applies a fishing mortality of 0.81 against a sustainable 0.426. Catch a trip fell from 626 kg to 454 kg in one year27.

Who it hits

Processors, cold-store operators, feed buyers and lenders financing against projected annual throughput.

How to manage it, and the opening

Size the plant for the worst recent year, and contract across several landing sites and seasons, since the variability belongs to the resource, not any supplier. Build the model on value added a tonne, not tonnes handled. The opening: a shrinking raw supply raises the value of post-harvest loss recovered (Pillars 5 and 6).

A crew member's cupped hands holding a fistful of small live anchovy and juvenile sardinella bait aboard a tuna vessel

The bait dependency inside the tuna fishery

HIGH
What it is

Ghana's pole-and-line tuna fleet catches its own live bait, and that bait includes juvenile round sardinella, the stock at about a tenth of its historical maximum. The healthiest fishery draws an essential input from the least healthy one, and takes it before it spawns.

Evidence

The bait is anchovy, juvenile round sardinella and round scad28. Round sardinella fell to 9.9 per cent of its historical maximum29. The same source calls all three bait species abundant, and the two anchovy assessments disagree outright30.

Who it hits

Tuna processors, cannery investors, and buyers relying on a pole-and-line sustainability claim for premium positioning.

How to manage it, and the opening

Require the bait composition and catch data before underwriting, read it against the sardinella assessment rather than the anchovy, and carry bait supply as a named line in the risk register. The opening: hatchery or imported bait, or gear that reduces live-bait dependence, is an unserved need with a captive customer and no competitor.

🐟 The Opening: what actually pays 🐟
01

Loss reduction and cold chain. No viable business here begins with catching more small pelagic fish; every opening sits after the landing, in losing less, grading, chilling and smoking cleanly (Pillars 5 and 6).

02

Alternative or certified bait supply. Hatchery or imported bait, or gear that reduces live-bait dependence, is an unserved need with a captive customer and no competitor (Pillar 4).

03

Independent data and price services. Current, credible landing and price data is a product several buyers would pay for, and nobody currently sells it (Pillar 7).

🐟 Key takeaways 🐟
01

Ghana has two marine fisheries in opposite conditions. Establish which one a proposal sits in before assessing anything else.

02

The small pelagic stocks have been overfished and overfishing since 2004, round sardinella at about a tenth of its historical maximum. No business here starts with catching more.

03

Tuna is 28.5 per cent of landings by weight and 34.6 per cent by value: it earns most per tonne while the canoe fleet earns most in total. All three tuna stocks are in good standing.

04

The tuna fleet's live bait includes juvenile round sardinella, the stock at about a tenth of its maximum. The healthiest fishery takes the sickest one's young, and no national plan prices it.

05

The fleet count rests on a 2016 census and a preliminary 2022 survey that disagree with the registers, no stock assessment uses data after 2019, and the first marine protected area was declared only in 2026. Knowing every figure here is dated is worth more than any single figure.

Written for each reader

🐟 Practitioner intelligence 🐟

Hover any card to pause and lift it.

For students

The first move: do not start by buying a canoe or a share in one. That asset carries the worst returns and the least control in the chain. Start by selling information or handling, neither of which needs much capital: spend a season recording daily landings, sizes and beach prices at one site and you will hold something no processor, lender or ministry has. Fish supply is allocated through credit relationships between traders and canoe owners that take a season to enter. What you leave with is the relationship and the data, the basis for later aggregation or processing business.

For entrepreneurs

Secure the offtake before the fish: sign a buyer for a graded, consistent product before committing to handling or processing capacity, since the constraint is a customer who pays for quality, not fish. Build backwards to supply, contracting across several landing sites, and size the facility for the worst recent year. The trap this sector punishes hardest is capacity built against an average landing figure from a 2016 or 2019 report.

For investors

The thesis is value per tonne, not tonnes: the resource has a ceiling and the volume line sits outside management's control. Require any tuna investment to produce its live-bait catch data and bait cost trend, and treat an inability to produce them as a finding, since the bait includes juvenile round sardinella from a stock at a tenth of its maximum. Require every volume assumption to state its base year, and discount any market sizing resting on the 2016 frame survey or the 2019 assessment. Release capital against verified throughput and a signed offtake, not installed capacity.

For ecosystem actors

The binding constraint: measurement. Restoring an annual marine canoe frame survey and publishing a monthly landing-beach price series would cost a fraction of any enterprise-support programme and move a measurable number: the share of fisheries business plans underwritten against verified volume, near zero. This sector has repeatedly funded landing infrastructure ahead of the data to site it: of nine landing sites planned under the last major donor programme, one was built. Public money should buy the evidence base that lets private capital price the risk.

Where this connects. The demand this stock cannot meet, and the imports filling it, are in Pillar 2. The illegal fishing and enforcement deciding how much stock survives are in Pillar 3. The fleets, and the premix fuel keeping too many at sea, are in Pillar 4.

Footnotes
  1. Fisheries Commission (2023).
  2. Fisheries Commission (2023).
  3. Ministry of Fisheries and Aquaculture Development (2022).
  4. Ocean Risk and Resilience Action Alliance (2025).
  5. Lazar et al. (2020).
  6. Lazar et al. (2020).
  7. Lazar et al. (2020).
  8. Lazar et al. (2020).
  9. Fisheries Commission (2023).
  10. Lazar et al. (2018).
  11. Fisheries Commission (2023).
  12. Fisheries Commission (2023).
  13. Fisheries Commission (2023).
  14. International Commission for the Conservation of Atlantic Tunas (2025).
  15. Key Traceability (2024).
  16. Ministry of Fisheries and Aquaculture Development (2022).
  17. Key Traceability (2024).
  18. Cook et al. (2021).
  19. Marine Stewardship Council (2026).
  20. Fisheries Commission, Dovlo et al. (2016).
  21. Fisheries Commission (2023).
  22. Fisheries Commission (2023).
  23. Ministry of Fisheries and Aquaculture Development (2022).
  24. Ocean Country Partnership Programme (2025).
  25. Key Traceability (2021).
  26. Lazar et al. (2020).
  27. Fisheries Commission (2023).
  28. Key Traceability (2024).
  29. Lazar et al. (2020).
  30. Cook et al. (2021).
  31. World Bank (2019).
Download full PDF
UpcomingThis document isn't available yet.