Ghana Agribusiness PlaybookMarine Fisheries
The trade in one line: imports feed the country, one export line earns the money.
Marine Fisheries · Pillar 02

Demand and Markets

Ghana imports 4.2 tonnes of fish for every tonne it exports, yet recovers almost all the money because what leaves is processed and what arrives is not. Nearly three quarters of that export value rides on one canned tuna line sold to the EU under a yellow card unlifted since 2021.
Demand and markets · Pillar 02

Ghana’s fish trade looks like an import story and behaves like an export-concentration story. The country brings in roughly four tonnes of fish for every tonne it ships out and recovers almost all the money, because what leaves is processed and what arrives is not. Nearly all that earning sits in one product, sold to one bloc, cleared by a European authority that has kept Ghana on a formal warning since 2021.

Wide banner of Tema harbour at dawn, stacked frozen fish import containers on one side and canned tuna export cartons on the other, a cargo ship at the quay, documentary photograph
Four tonnes in, one out
The trade in one line: imports feed the country, one export line earns the money.
4.2 tonnes
imported for every tonne of fish Ghana exports
72%
of fish export value is a single canned tuna line
~80%
of export value goes to the EU, held under an unlifted yellow card

🐟 What Ghana eats, and its honest state 🐟

At least five per-capita fish-consumption figures circulate, on three methods that do not average. The Fisheries Commission’s outcome indicator puts intake at 17.8 kg a person a year, down from 20.8 kg the year before1, carried to 18.04 kg provisional for 2024; the food balance sheet gives 23.6 kg a person a year of apparent availability, a food balance residual in live weight rather than a measure of intake2.

17.8 kg against 23.6 kg differs by a third; across 33.8 million people that is about 196,000 tonnes, more than three times Ghana’s recorded fish export weight. The Ministry moved from 25 kg in 2024 to 17.8 kg in 2025 with no methodological note, so market sizing built on the older figure is now nearly two fifths too large.

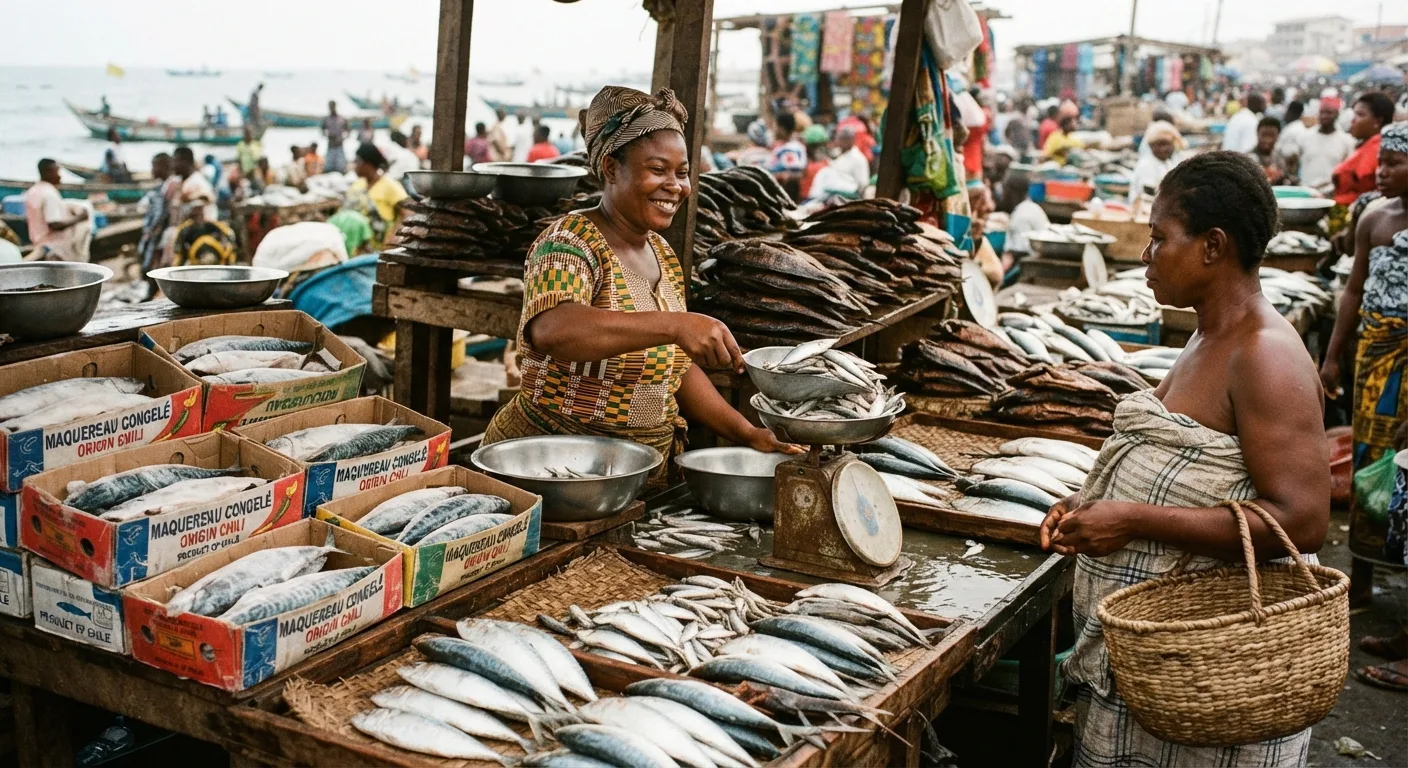
A busy Ghanaian fish market stall with fresh and smoked small pelagic fish beside cartons of frozen imported mackerel, a trader weighing fish for a customer, documentary photograph
Table 3: The fish-consumption figures in circulation, on three measurement bases
The figure in circulationWhat it actually measuresBasis
17.8 kg (2023), 18.04 kg (2024 provisional)A ministry outcome indicator for intakeAdministrative; the measure is not defined in either document
23.6 kg (2023)Fish available per resident, not fish eatenA food balance residual in live weight, so it counts fish never eaten as food
25 kg (baseline 2022)The same ministry indicator, one budget earlierAdministrative; moved about 7 kg in one budget cycle with no note

Sources: Fisheries Commission (2023); Ministry of Fisheries and Aquaculture Development, Programme Based Budget 2024 and 2025 editions; Food and Agriculture Organization GLOBEFISH profile, data year 2023; Ministry of Fisheries and Aquaculture Development, National Fisheries and Aquaculture Policy (2022).

What this means. Print the per-capita assumption next to any demand number you use, and never plot these figures as a single falling line. They sit on three different bases, so a line through them measures nothing, and the sharpest step in the series is a ministry changing its own indicator between two budgets, not Ghanaians eating less.

🐟 The gap, and the denominator that decides its size 🐟

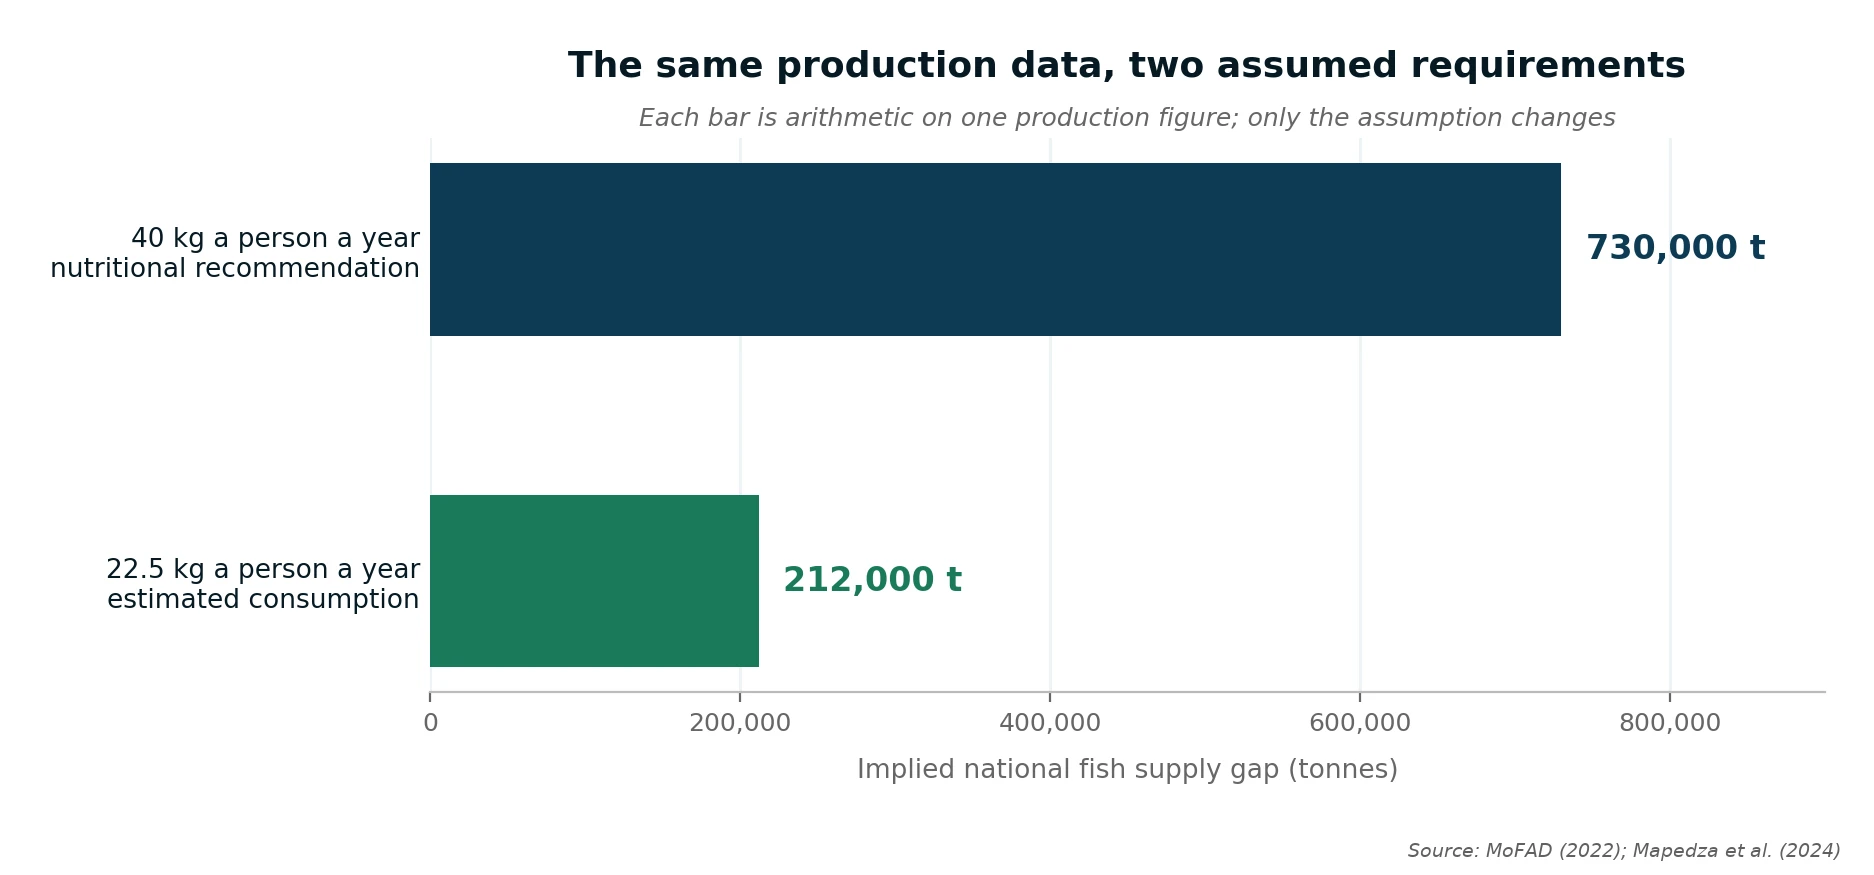
Two national supply gaps are quoted, 212,000 and 730,000 tonnes: the same production, two assumed requirements. On the recommended 40 kg a person, requirement over 2015 to 2020 averaged about 1.18 million tonnes against production of 450,000 tonnes, a 730,000-tonne gap; on the 22.5 kg the same document takes as actual consumption, the gap is about 212,000 tonnes, or 32 per cent of requirement3. A third figure, 640,182 tonnes, is an import measure, not a requirement shortfall4.

The same production data against two assumed requirements, giving two national fish supply gaps
Figure 4 The same production data against two assumed requirements, giving two gaps
What this shows

Nothing on the right-hand side is measured. Each bar is arithmetic on the same domestic production figure, and the only thing that changes between them is the per-capita requirement someone chose. The 40 kg figure is a nutritional recommendation and not a statement of what Ghanaians buy, so the bar it produces is a policy aspiration expressed in tonnes. Any market sizing lifted from a gap number without its assumption attached is unusable.

730,000 t
the gap on the 40 kg nutritional recommendation
212,000 t
the gap on 22.5 kg, the same document's actual consumption

Two fractions have different denominators and get swapped. The Commission reports domestic production at 44.4 per cent of national requirement, down from 52.0 per cent the year before5, requirement being a per-capita norm times population. Import share is measured against the fish that exists: marine landings came to an estimated 442,360.86 tonnes in the 2024 reporting period6. Set 222,153 tonnes of frozen imports against that plus aquaculture of roughly 115,000 to 122,000 tonnes and imports are about 28 per cent; add inland capture and the share falls to about 26 per cent. Name the denominator whenever you quote either share.

Imports are 28 per cent of what Ghana eats while it falls 56 per cent short of official need, because the shortfall is people eating less, not imports. Only the 28 per cent supports an import-substitution case, at half the scale the 56 per cent implies. Size a venture against the 56 per cent and you have doubled your addressable market on a definition.

What this means.Ask any business plan one question: is the gap it quotes measured against what Ghanaians are deemed to need, or against what Ghana actually has? The two differ by a factor of two and the documents almost never say which. Imports supply a little over a quarter of Ghana’s fish; the rest of the deficit is unmet demand at a price people will not pay, which is not a market.

🐟 Imports: four tonnes in for every tonne out, and the money nearly balances 🐟

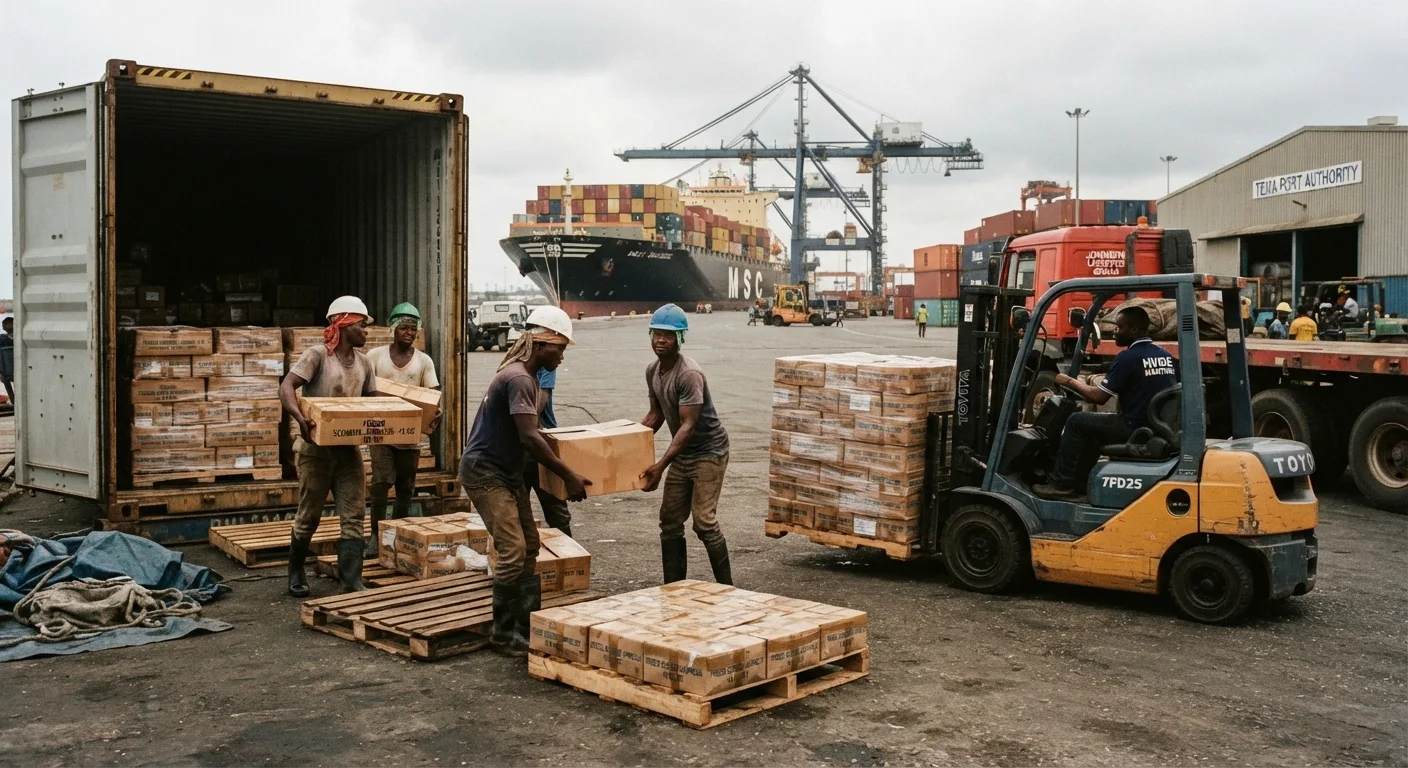
Dockworkers offloading cartons of frozen imported mackerel from a shipping container at a Ghanaian port, a forklift and stacked pallets nearby, documentary photograph
Whole, frozen, and cheap in
What arrives: small pelagic fish of the kind Ghana’s own canoes land.
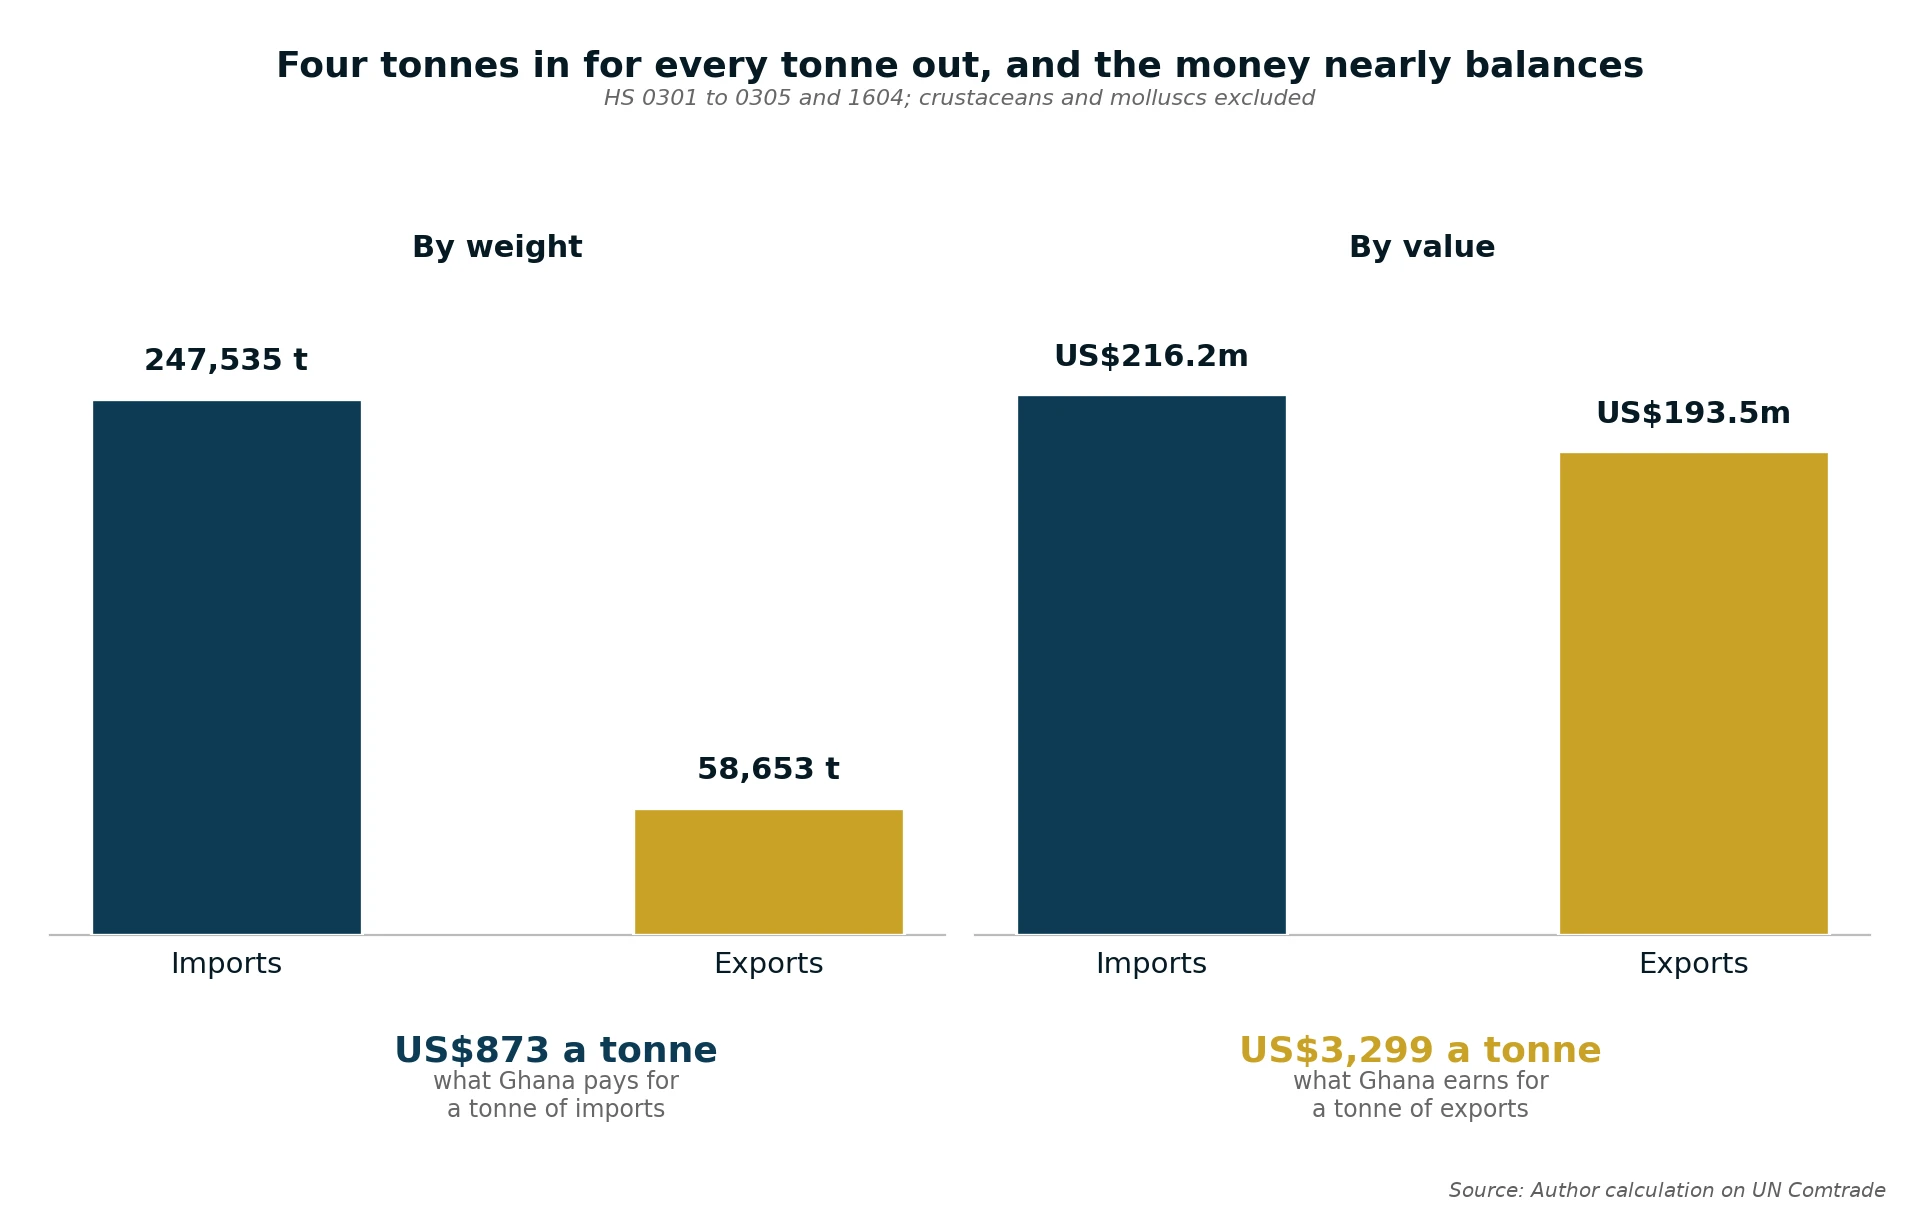
Imports and exports of fish by weight and by value, showing four tonnes in for every tonne out but the money nearly balancing
Four tonnes in for every tonne out, and the money nearly balances

In 2023 Ghana imported 247,535 tonnes of fish for US$216.2 million and exported 58,653 tonnes for US$193.5 million: 4.2 tonnes in for every tonne out, recovering about 90 cents of every dollar (author calculation on UN Comtrade data, HS 0301 to 0305 and 1604). The reason is form, not species: whole frozen fish is 90 per cent of import weight and 85 per cent of import value, while canned and prepared product is 74 per cent of export value on 45 per cent of export weight, so unit values run US$873 a tonne in against US$3,299 out. Canning earns that spread, not catching.

What arrives is small pelagic fish of the kind Ghana’s own canoes land. Frozen mackerel is the largest import line by value at US$76.5 million, ahead of jack and horse mackerel at US$39.0 million and sardines and sardinella at US$17.0 million7. Suppliers are led by Mauritania, China and Morocco8. Imports peak in the November to May lean season9, so the trade is counter-seasonal, hardest when local supply and price are tightest.

Two policy interventions sit on that flow, neither modelled with confidence. Tilapia imports have been prohibited in all forms since 2014, reaffirmed 2022, mainly an aquaculture matter10. The live one is the frozen seafood levy: in 2023 the government announced a 1,573 per cent increase, from GH¢15.00 to GH¢251.00 a tonne, payable in US dollars, alongside removal of the benchmark discount and a VAT rise. Reporting describes an attempted increase, not an implemented one: importers warned they would clear cargo in Togo and Cote d’Ivoire and truck it across11. No source confirms it took effect. Model it as a range.

Table 4: What crosses the quay in each direction, by product form, 2023
Product formImports, tonnesImports, US$mExports, tonnesExports, US$m
Frozen fish, whole (HS 0303)222,153183.425,50339.4
Prepared or preserved (HS 1604)19,58927.626,543143.2
Fresh or chilled (HS 0302)3,5903.55,5836.2
Dried, salted or smoked (HS 0305)1,9371.2weight not recorded0.3
Fillets (HS 0304)2620.36133.0
Live (HS 0301)40.034111.4
All lines above247,535216.258,653193.5

Source: author calculation on the UN Comtrade trade data extract. Crustaceans and molluscs (HS 0306 to 0308) are excluded from both columns. Export weight excludes the dried and smoked line, for which no net weight was recorded.

The part of this trade that can change overnight. The import trade is the part of this commodity a newcomer can actually enter, and the part most exposed to a budget-speech policy change. A levy at sixteen times its previous level, payable in dollars, turns a working-capital plan into a currency position, and the border is porous enough to route around it. Since nobody can confirm whether it is being collected, model the landed cost with the levy in and out, and treat the difference as your policy exposure.

🐟 Exports: one product, one customer, three factories 🐟

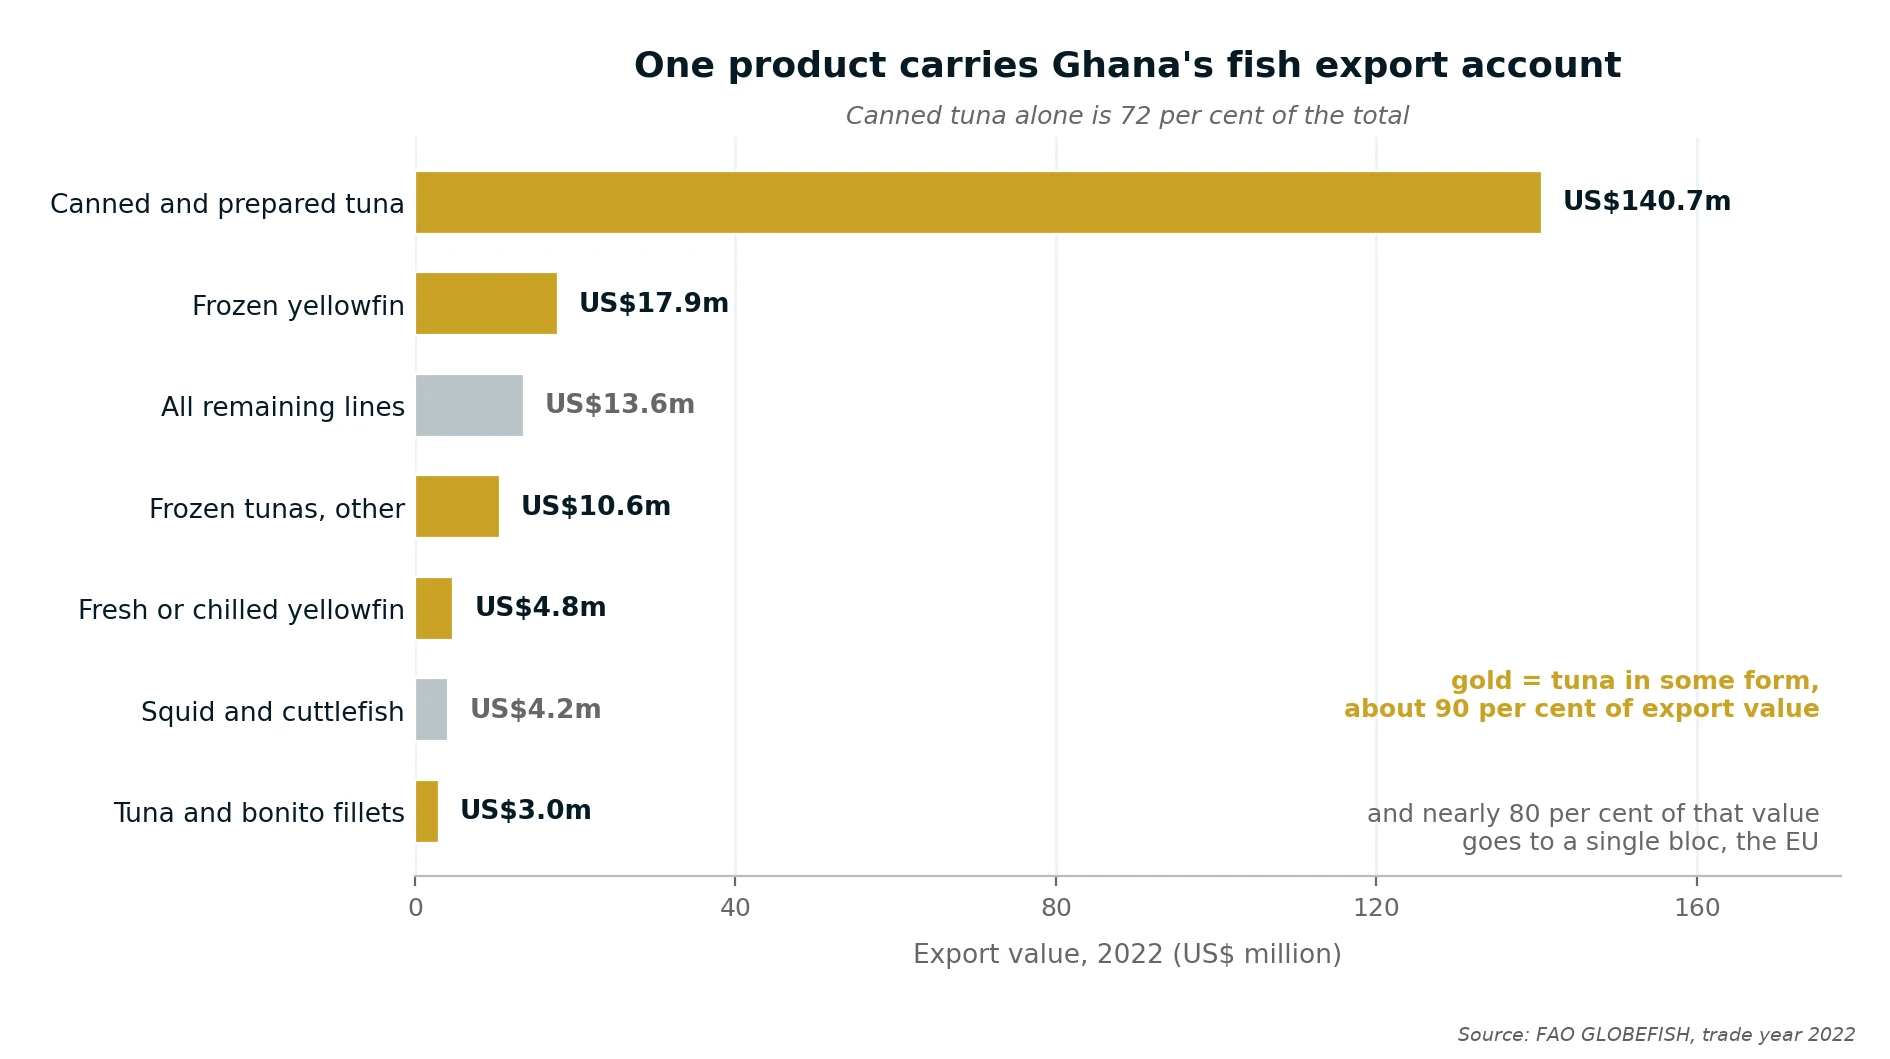
Canned and prepared tuna earned US$140.7 million of Ghana’s US$194.8 million in fish exports in 2022: a single customs line is 72 per cent of the national export account, and tuna in all forms about 90 per cent12. Processed product is 77 per cent of export value; unprocessed is 86 per cent of import value.

Ghana's fish export value by product line, showing how little of it isn't tuna
Figure 5 Ghana’s fish export value by product line, and how little of it isn’t tuna
What this shows

Tuna in some form is about 90 per cent of the bars on this chart and a single canned line is 72 per cent of the total. Read it beside the customer split: nearly 80 per cent of export value goes to one bloc. A concentration this tight is not a market position, it is a dependency, and it is held in place by three canneries in one port and by a European sanitary and illegal-fishing clearance that Ghana does not itself control.

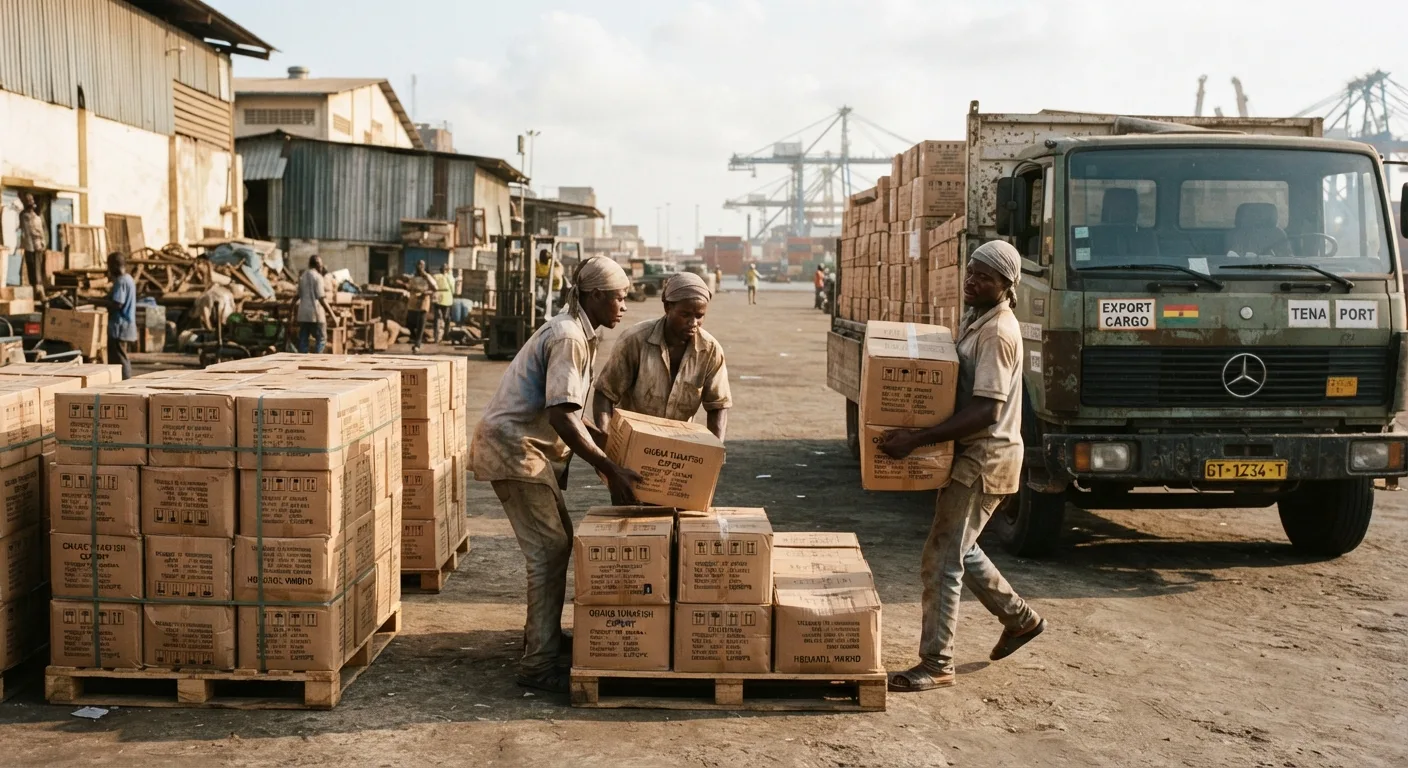
Workers loading export cartons of canned tuna onto a truck outside a Tema canning factory, pallets of boxes stamped for export, documentary photograph
Three plants, one port
The working proof: the only species that has managed European market access at scale.
US$140.7m
canned and prepared tuna, of US$194.8m total fish exports
~40,000 t
processed a year by three Tema canneries, no published ceiling

The customer is as concentrated as the product. The European Union takes nearly 80 per cent of seafood export value, China second by volume, and the capacity behind it is three tuna canneries at Tema processing about 40,000 tonnes a year almost entirely for export, holding European sanitary approval and a hazard analysis and critical control point regime13. No processing ceiling is published, so headroom above 40,000 tonnes is the largest unverified number and the first thing a tuna investment should establish. Demand is not the constraint: tuna is the largest species in European per-capita consumption at 2.68 kg, down 9 per cent in 2023 to the decade’s low14.

What this means. Every commercial argument about adding value to fish has a working local proof: the cannery. Tuna is the only Ghanaian fishery with a healthy stock, an international assessment, a European sanitary clearance and a buyer who contracts by the container, and the real question is why one species has managed it.

🐟 The two conditions on that customer: a warning and a certificate 🐟

This export account is only as secure as its access to one market. Ghana holds a second European Union yellow card, issued 2 June 2021 and, on the last public confirmation in October 2025, still not lifted15. A yellow card is a warning and restricts nothing; a red card would, prohibiting fishery exports to the European Union, and nearly 80 per cent of export value would have nowhere to go at short notice. The grounds are not about tuna: the Commission cited an expired marine fisheries management plan, transshipment at sea, inconsistencies in the fisheries legal framework, and deficiencies in the monitoring, control and surveillance of fleets16. Those failings belong to the small pelagic fishery and its enforcement, but the exposure falls on the tuna exporters. Ghana is one of only two countries carded a second time after clearing a first, Panama the other, and five years on it remains uncleared.

January 2026 brought the counterweight: certification of Ghana’s Atlantic skipjack and yellowfin tuna fisheries to the Marine Stewardship Council standard, covering both the purse seine and the pole-and-line fleets17. Certification is what a European retailer contracts against, commanding shelf space an uncertified competitor cannot reach. It protects the tuna trade from commercial pressure but not from a red card, because carding applies to countries, not fisheries.

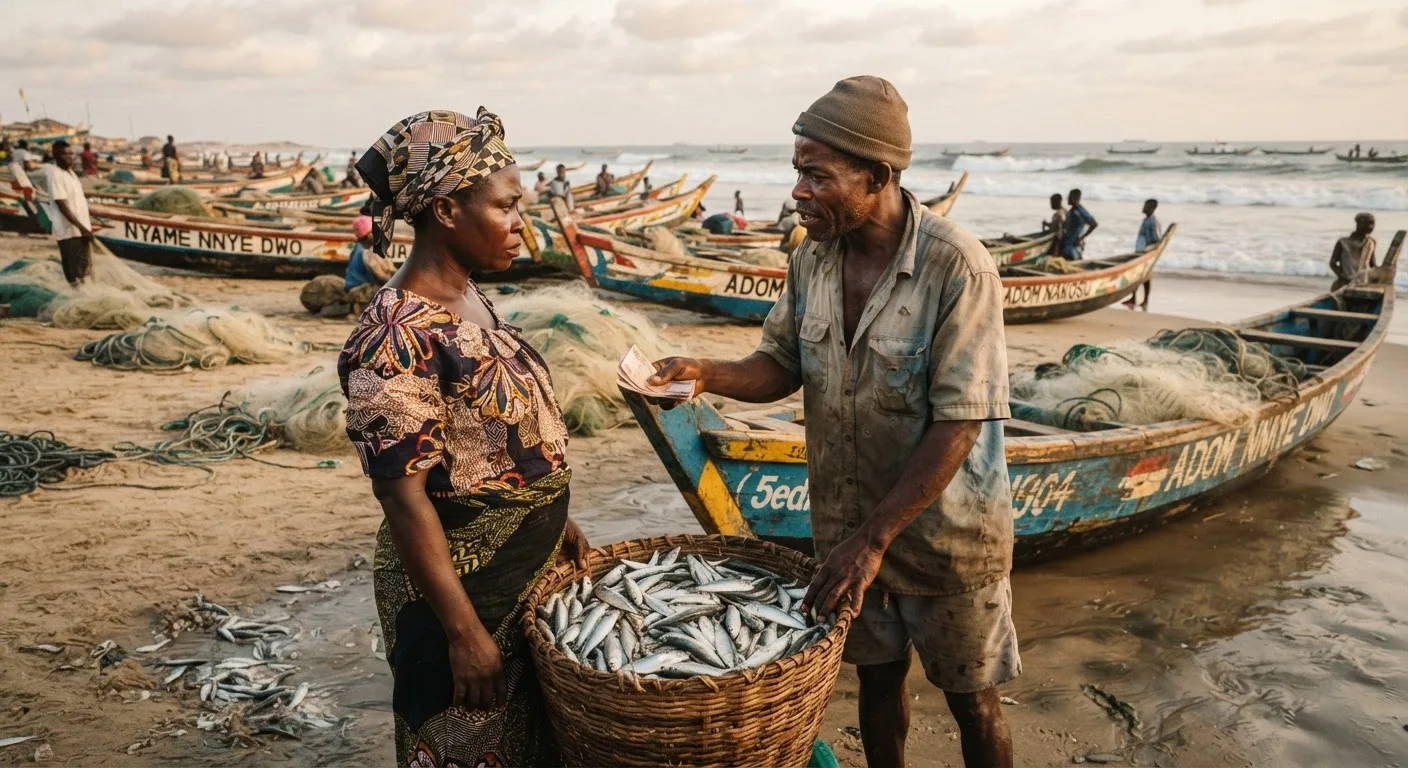
A fish trader and a canoe fisherman negotiating a price over a basket of small pelagic fish at a Ghanaian landing beach, canoes and nets in the background, documentary photograph
2 June 2021
the yellow card issued, still not lifted at last confirmation
22 Jan 2026
Marine Stewardship Council certification for skipjack and yellowfin
Table 5: The market-access ledger a fish exporter or importer is trading under
ConditionStatus as at July 2026What it does to trade
European Union yellow card, issued 2 June 2021In force at the last public confirmation, October 2025; no lifting announcedA warning only. A red card would close the bloc taking nearly 80 per cent of export value
Marine Stewardship Council certification, 22 January 2026Granted for skipjack and yellowfin, purse seine and pole-and-lineOpens premium European and UK retail shelf; subject to annual surveillance audit
Traceability labelling under the 2025 ActIn the statute; the Regulations that give it effect are still in draftMandatory on both legs once in force, with artisanal catch exempt
Import and export permits under the 2025 ActOne permit per transaction, valid three months; fee not yet prescribedA working-capital and lead-time cost, not yet budgetable
Frozen seafood levy of GH¢251 a tonneIntroduced 2023; current status unconfirmedIf it stands, a dollar-denominated cost on every imported tonne

Sources: European Commission (2021); Marine Stewardship Council (2026); Fisheries and Aquaculture Act 2025, sections 109 and 111; Nyarko (2023). The statutory detail is taken up in Pillar 8.

Where the uncontested space actually is. The certificate and the carding together define the opening. A European buyer who wants certified West African tuna has few places to go, and a Ghanaian supplier who can document chain of custody from a certified fishery is selling scarcity. The same logic has not been applied to anything else Ghana lands: no small pelagic product carries a certification or origin mark, while the pole-and-line tuna fishery has a certification and a published improvement project. The smoked product that dominates the domestic trade exported US$0.30 million in 2023. Whether that gap is a market failure or a market signal is what Pillars 5 and 6 test.

🐟 Prices: the number nobody publishes 🐟

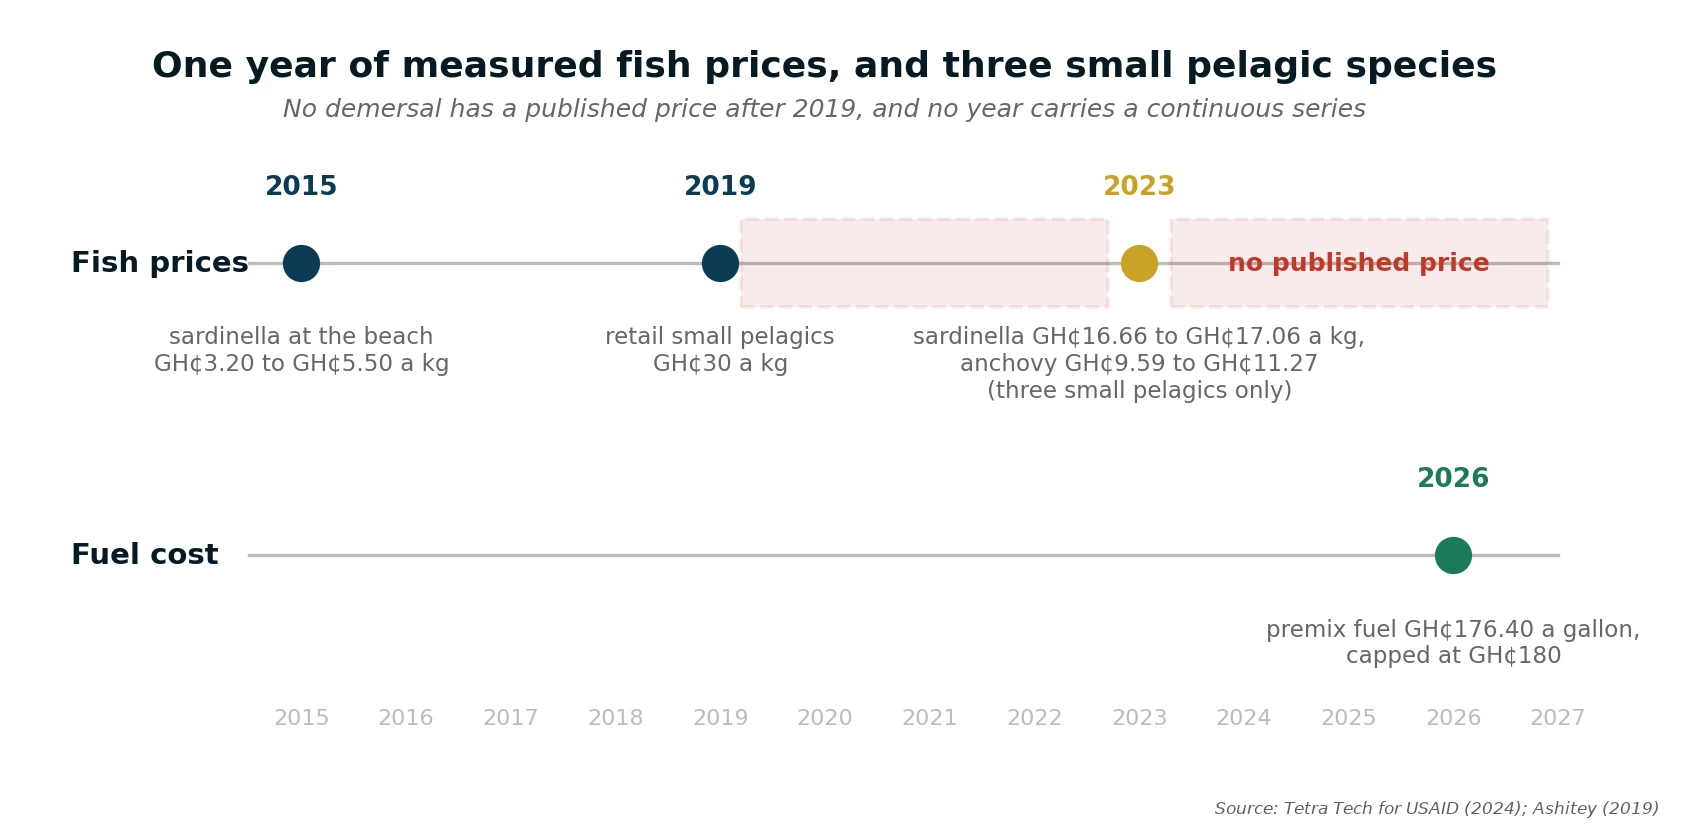
What is actually known about Ghanaian fish prices, showing measured points in 2015, 2019 and 2023 and no published price since
Figure 6 What is actually known about Ghanaian fish prices, and what is not
What this shows

An operator can price the fuel going into a canoe to the cedi and cannot price the fish coming out of it. Every revenue line in every fisheries business plan written in Ghana this year rests either on a 2019 retail figure or on the writer’s own fieldwork, and the two are not interchangeable. This is why the cost model accompanying this playbook cannot price its revenue side, and it is also a commercial opening: a credible monthly landing-beach price series has several buyers in this chain and no seller.

GH¢16.91 to GH¢16.66
round sardinella landing price, before and after the 2023 closure
2019
the last year any demersal species had a published price

Action points. Collect your own prices before you commit capital, at three points: what the canoe is paid, what the processor pays, and what the market sells at, for the same fish on the same day. Nobody in Ghana publishes that ladder. Two seasons of it, from three landing sites, is a defensible revenue line, an asset a lender will look at, and a product several buyers in this chain would pay for.

What Ghana publishes on its own fish prices is three small pelagic species, two gear types, one closed season. The Fisheries Scientific Survey Division measured landing prices either side of the 2023 closure, the newest in the evidence base: a mean landing price of GH¢16.91 a kilogram before the 2023 closed season and GH¢16.66 after it for round sardinella taken on ali, poli and watsa gear, with flat sardinella at GH¢16.66 rising to GH¢17.0618. Anchovy carried a mean landing price of GH¢9.59 a kilogram before the 2023 closed season and GH¢11.27 after it, on ali, poli and watsa gear19. There is a gear premium: set net landings priced higher than purse seine for the same species, flat sardinella reaching GH¢24.20 a kilogram before the 2023 closed season against GH¢16.66 on ali, poli and watsa gear20.

Then it stops. The coverage is prices for three small pelagic species on two gear types around a single closed season, and nothing at all for demersals, nothing after 2023 and no continuous series in any year21. No demersal species has a published price since 2019, and a live search of 2025 and 2026 sources returned nothing from any Ghanaian institution. The consequence is actionable: a sardinella buyer can anchor on a real 2023 number; everyone else is negotiating against a price nobody has measured.

A retail band of roughly GH¢52 to GH¢94 a kilogram circulates from a commercial aggregator, but it states no methodology and is species-blind, so it is not used as a sardinella, anchovy or tuna price here.

Fish is sold by size, not weight, so a technology that improves a product while shrinking it is punished. The beach price is set by the buyer, not the fisher, because processors and traders prefinance the trip. Both belong to Pillar 6. Those who set prices have the information, those who take them do not, which is why Pillar 5 cannot price its whole revenue side while its premix fuel line is exact to the pesewa.

🐟 The risks inside the market 🐟

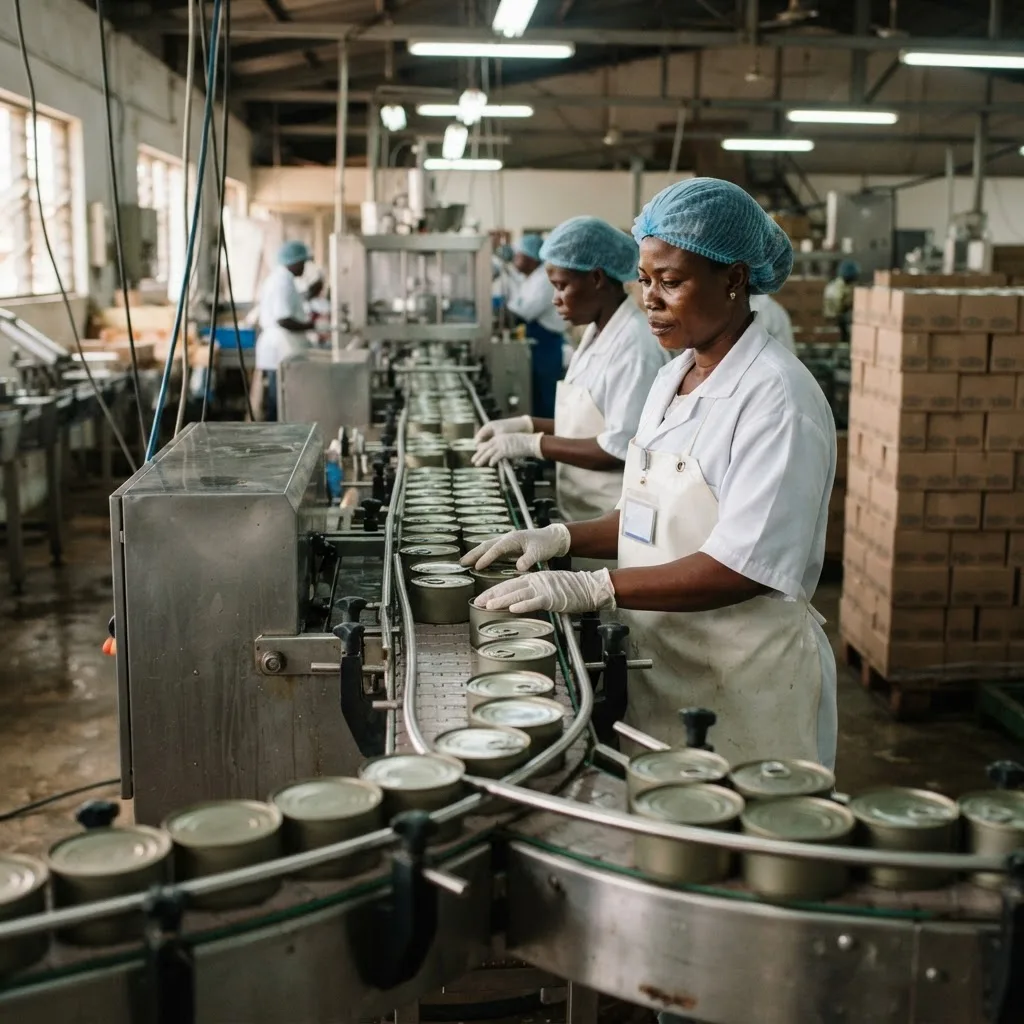
Workers in hairnets and aprons packing canned tuna at a conveyor line inside a Tema canning factory, cartons stacked behind them

One product, one customer, three factories

VERY HIGH
What it is

Ghana's fish export account is a single canned tuna line sold overwhelmingly into one trading bloc and processed in three plants in one port. A sanitary suspension, a carding escalation or the closure of one factory would each remove a large share of national fish export earnings at once, with no second product or market positioned to absorb it.

Evidence

Canned and prepared tuna earned US$140.7 million of US$194.8 million in fish exports in 2022, tuna in all forms about 90 per cent22. The European Union takes nearly 80 per cent of seafood export value, and three canneries at Tema process about 40,000 tonnes a year23.

Who it hits

Cannery investors and their lenders, tuna vessel owners on joint-venture terms, the Ghanaian state as a foreign-exchange earner, and everyone downstream of the three Tema plants.

How to manage it, and the opening

Underwrite a tuna investment against the market-access conditions, not only the stock assessment, and require sight of the plant's European approval status and surveillance audit history. Price a second market into the model even if it is never used. The opening is diversification of product and destination: nothing else Ghana lands carries a certification or origin mark, and the certified tuna chain is a working template for building one.

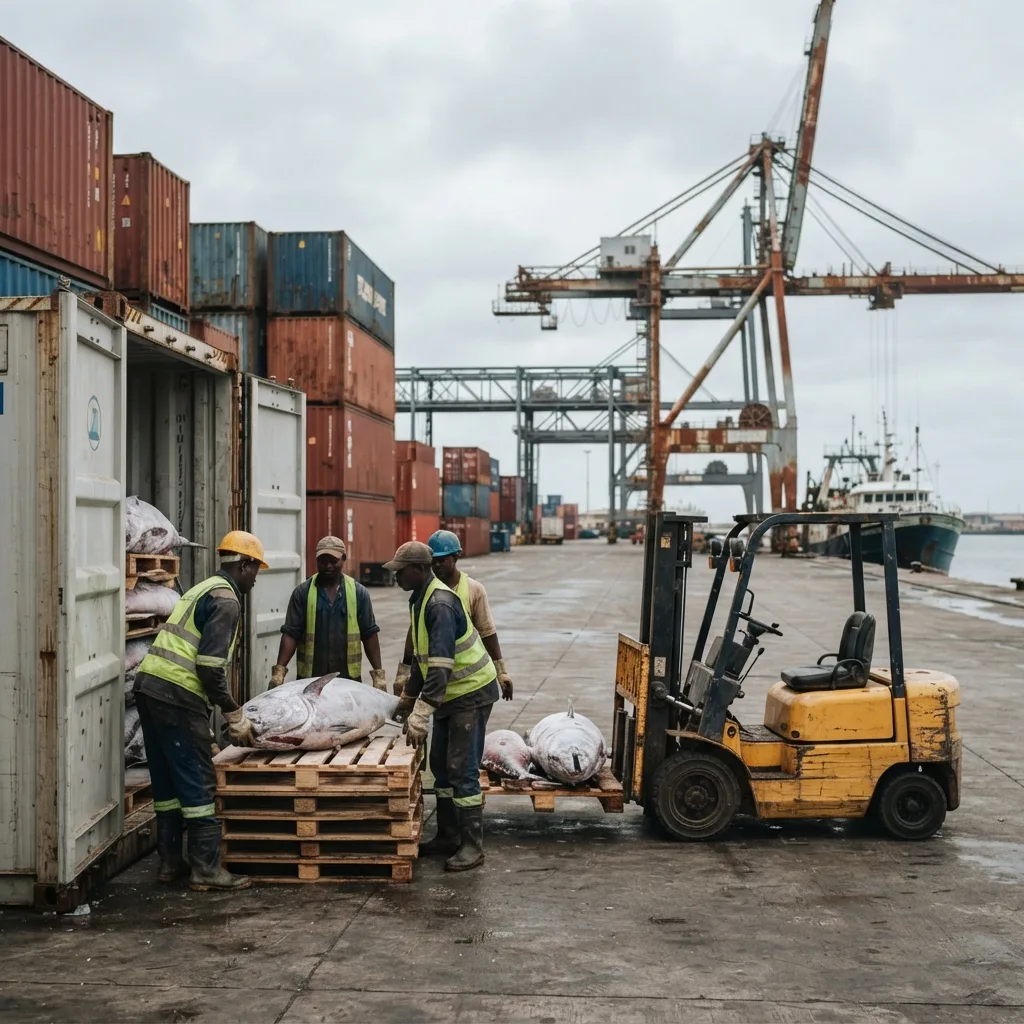
Dockworkers loading whole tuna onto pallets beside shipping containers and a forklift at a Ghanaian port, a cargo vessel behind them

An unlifted European yellow card over an export that depends on Europe

HIGH
What it is

Ghana has been formally warned by the European Union over illegal fishing since June 2021 and remains uncleared five years later, having been carded a second time after clearing a first, which only Panama had previously been. The warning itself restricts nothing, so the risk is entirely in the tail: an escalation would prohibit fishery exports to the market taking nearly 80 per cent of Ghana's fish export value.

Evidence

The card was issued on 2 June 2021 on grounds of illegal transshipment of undersized juvenile pelagics, weak monitoring and control, and inadequate sanctions24. It remained in force at the last public confirmation in October 2025, and no lifting or escalation has been announced as at July 2026.

Who it hits

Tuna exporters and canneries, their European buyers, any investor whose exit depends on European market access, and the trawl and canoe operators whose conduct is the subject of the warning.

How to manage it, and the opening

Treat carding status as a covenant-level item reviewed at every board meeting, not as country background, and build the compliance evidence a lifting would need into normal operations. Watch the section 169 Regulations and the enforcement record in Pillar 3. The opening is in the remedy: monitoring, catch documentation and traceability services Ghana must buy to clear the card are not being sold here at scale.

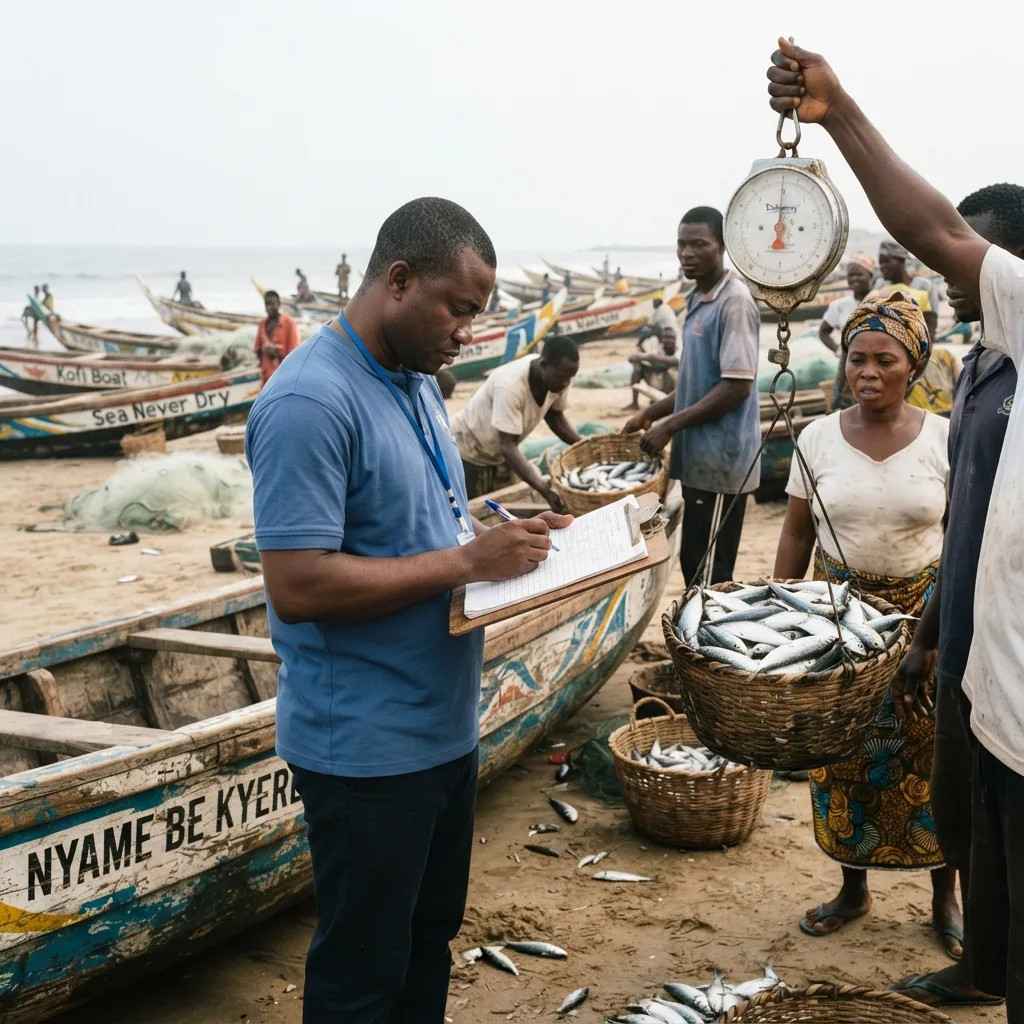
A fisheries officer with a clipboard recording a catch as a trader weighs a basket of small pelagic fish on a hanging scale at a landing beach

Trading on a number the state contradicts itself on

MEDIUM-HIGH
What it is

Ghana's official fish import and export volumes differ between the government's own series, which count different things with no document reconciling them, and the only published fish price after 2019 covers three small pelagic species in one year. Market sizing, revenue forecasting and import-substitution cases here are routinely built on one figure with no range attached.

Evidence

For 2023 the Ministry's trade indicator gives 84,828 t imported and 203,104 t exported, its permit tables count 159,162 t and 21,931 t of authorisations, and UN Comtrade records 247,535 t and 58,653 t of customs-cleared trade. The newest Ghanaian fish price in the evidence base is the 2023 landing measurement of three small pelagic species.

Who it hits

Anyone preparing a feasibility study, a grant application or an investment committee paper, and any lender relying on one.

How to manage it, and the opening

Quote trade volumes from a source that states its basis, print the alternative figure beside it, and never carry a per-capita or gap number without its assumption in the same sentence. Treat primary price collection as a budget line, not a refinement. The opening is the one Pillar 1 identified: current, credible landing and price data is a product with several buyers in this chain and no seller.

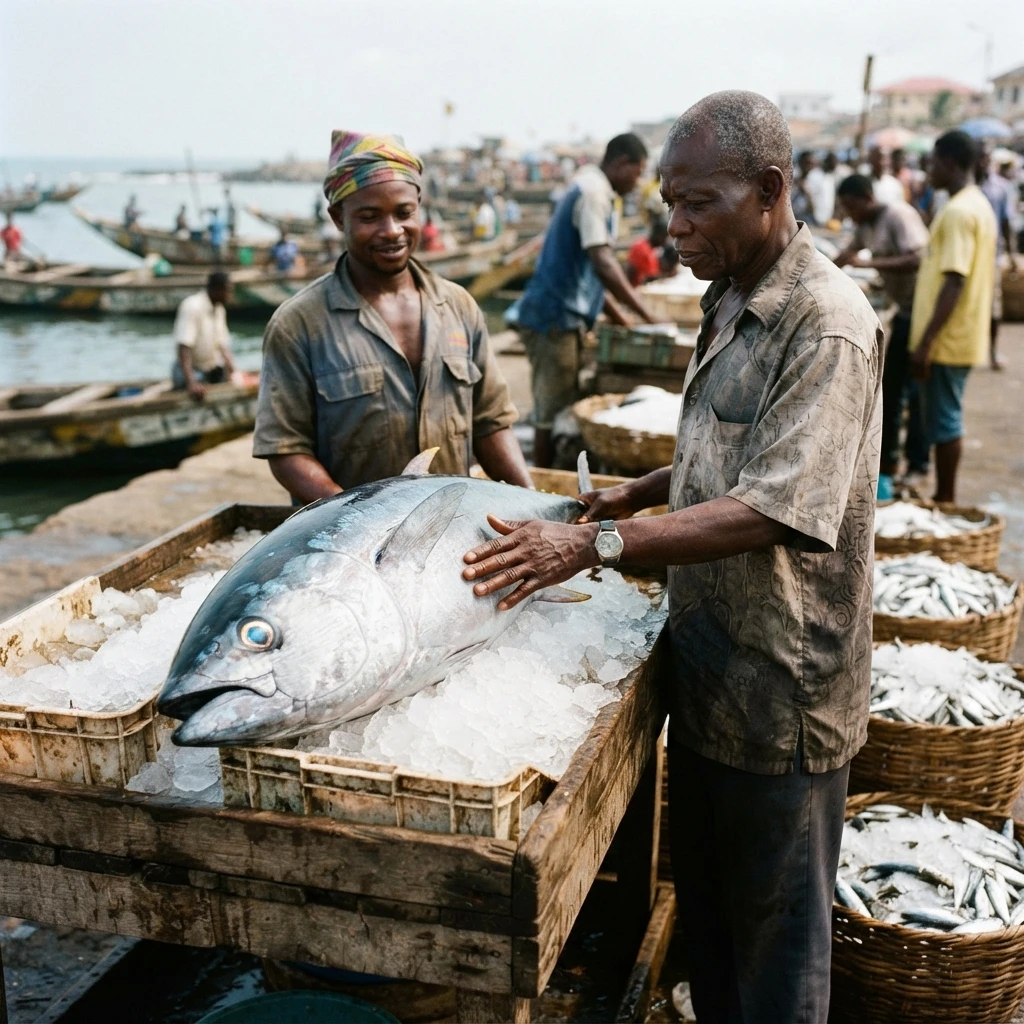
Fishery workers inspecting a large tuna packed in ice on a wooden table at a Ghanaian landing site, baskets of small pelagic fish beside them
The template already exists
Nothing else Ghana lands carries a certification or origin mark, and the certified tuna chain is the working template for building one.
🐟 The Opening: what actually pays 🐟
01

Diversification of product and destination. Nothing else Ghana lands carries a certification or origin mark, and the certified tuna chain is a working template for building one.

02

The remedy the yellow card requires. Monitoring, catch documentation and traceability services Ghana must buy to clear the card are not being sold here at scale.

03

Landing and price data, still unsold. Current, credible landing and price data is a product with several buyers in this chain and no seller.

🐟 Key takeaways 🐟
01

Ghana's per-capita fish consumption has at least five figures on three bases and they are not one series. Print the assumption in the same sentence as any demand number, and never plot them as a single falling line.

02

Self-sufficiency of 44.4 per cent is measured against national requirement, while imports are about 28 per cent of actual supply. Only the second supports an import-substitution case, and it does so at about half the scale of the first.

03

Ghana imports 4.2 tonnes of fish for every tonne it exports and recovers about 90 cents of every dollar, because imports come in whole and frozen at US$873 a tonne and exports leave canned at US$3,299 a tonne.

04

Canned tuna is 72 per cent of fish export value, tuna in all forms about 90 per cent, and the European Union takes nearly 80 per cent of it through three canneries in one port. That concentration is the single largest market risk in the commodity.

05

A June 2021 European yellow card is still unlifted, a Marine Stewardship Council certificate arrived in January 2026, and the only Ghanaian fish price published since 2019 covers three small pelagic species around the 2023 closed season. All three are things a business can act on directly.

Written for each reader

🐟 Practitioner intelligence 🐟

Hover any card to pause and lift it.

For students

Start with the price ladder nobody publishes. With a notebook, a hanging scale and a season of early mornings you can record what the canoe is paid, what the processor pays and what the market charges for the same fish on the same day at one site. No such record exists in Ghana after 2019. Do not begin by buying fish to resell: the landing is already committed to the trader who prefinanced the trip. What you leave a season with is that relationship, a dataset processors and lenders will take a meeting for, and a real sense of the margins before risking capital.

For entrepreneurs

First move: sign the buyer before you touch the fish. The scarce thing is not supply, which arrives by the container from Mauritania and China, but a customer who pays a premium for consistency, and the Ghanaian proof of that is a canned tuna line worth US$140.7 million. Secure the offtake, specify the product to that buyer's standard, then build only the capacity the contract needs. Model your landed cost twice, with the 2023 frozen seafood levy of GH¢251 a tonne and without it, because nobody can tell you which case is live. Do not build import substitution on the 640,182 tonne figure as a national deficit: the fraction describing your market is the 28 per cent import share of real supply.

For investors

The investable thesis: value per tonne on the export leg and policy-adjusted landed cost on the import leg, because the volume side of both is unreliable and the resource has a ceiling. Require any cannery investment to produce its current capacity and utilisation, since the circulating figure is about 40,000 tonnes and no ceiling is published. Require sight of European sanitary approval and surveillance audit history, and treat the unlifted yellow card as a covenant item. Require every trade volume to name its source, because Ghana's own documents give the 2023 export volume as a permit count and a trade indicator that are not the same measure. Market-access concentration is the dominant risk, sized by asking what share of revenue would survive a red card.

For ecosystem actors

The lever: a published price series and a single defined trade measure. A monthly landing-beach and wholesale price bulletin for five species at ten sites, and one gazetted definition of what the ministry's import and export volume indicators count, would cost less than one harbour rehabilitation and would move a measurable number: the share of fisheries business plans underwritten against verified revenue, currently close to none. Make publication a condition of the money rather than an afterthought, because no bank can finance a revenue line with no observable market price.

Where this connects. The stock ceiling behind every demand figure, and the bait dependency inside the certified tuna fishery, are in Pillar 1. The enforcement record the yellow card is about, including the trawl transshipment trade named in its grounds, is in Pillar 3. The price formation, missing cold chain and post-harvest loss are in Pillars 5 and 6, and the statutory permit, traceability and levy detail is in Pillar 8.

Footnotes
  1. Fisheries Commission (2023).
  2. Food and Agriculture Organization (2023).
  3. Ministry of Fisheries and Aquaculture Development (2022).
  4. Mapedza et al. (2024).
  5. Fisheries Commission (2023).
  6. Ministry of Fisheries and Aquaculture Development (2025).
  7. Food and Agriculture Organization (2023).
  8. Nyarko (2023).
  9. Ministry of Fisheries and Aquaculture Development (2022).
  10. Taylor (2022).
  11. Nyarko (2023).
  12. Food and Agriculture Organization (2023).
  13. Ashitey (2019).
  14. European Market Observatory for Fisheries and Aquaculture Products (2025).
  15. European Commission (2021).
  16. Fisheries Commission (2023).
  17. Marine Stewardship Council (2026).
  18. Tetra Tech for USAID (2024).
  19. Tetra Tech for USAID (2024).
  20. Tetra Tech for USAID (2024).
  21. author assessment of the evidence base (2026).
  22. Food and Agriculture Organization (2023).
  23. Ashitey (2019).
  24. European Commission (2021).
Download full PDF
UpcomingThis document isn't available yet.