Ghana Agribusiness PlaybookTilapia & Catfish
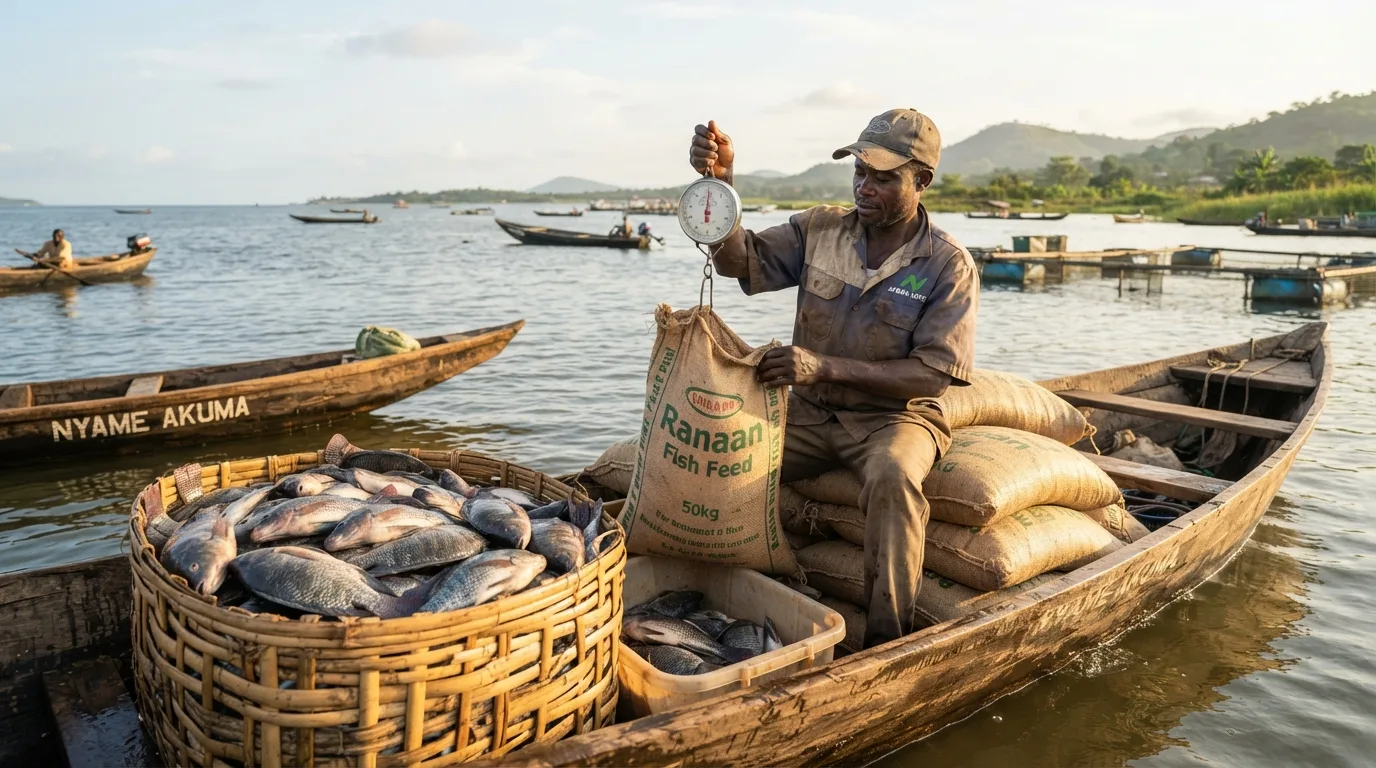
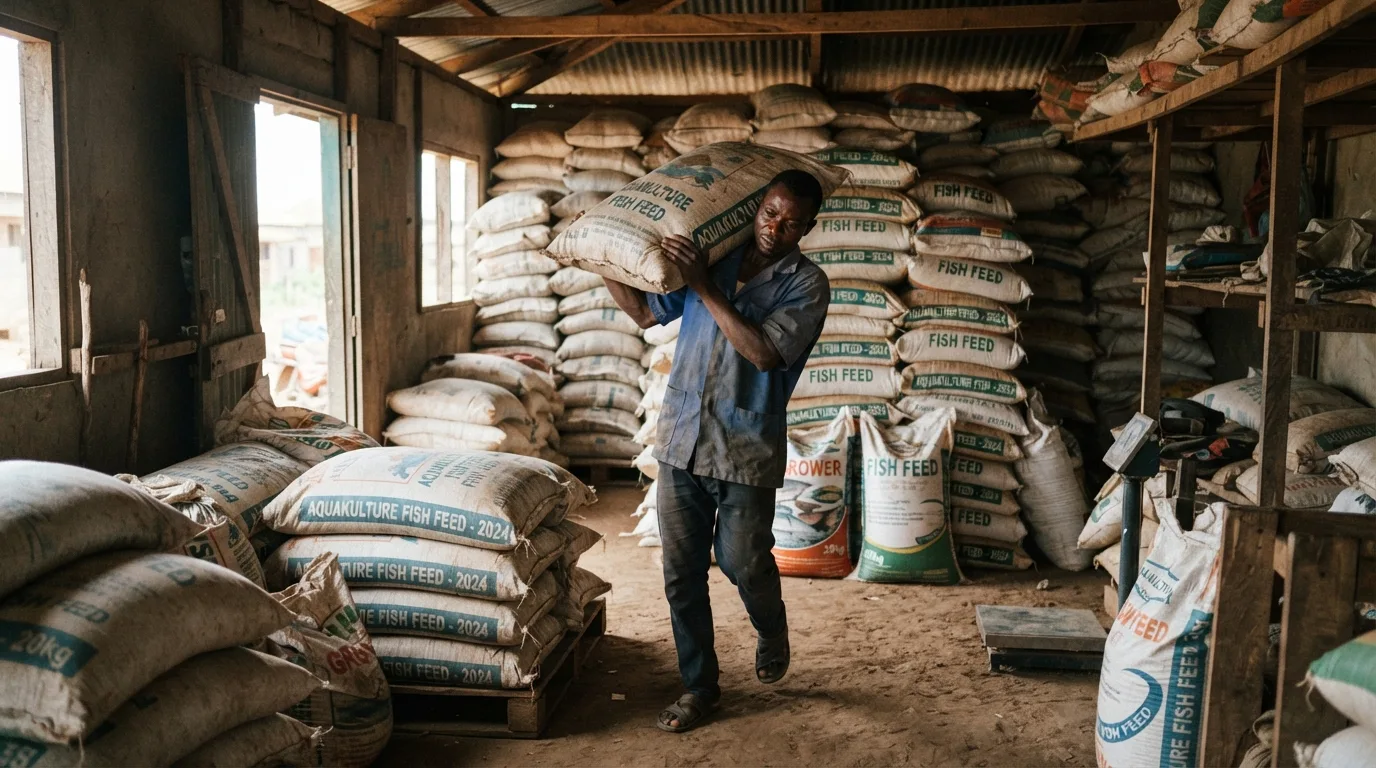
A fish farmer weighing sacks of feed against a harvest of market-size tilapia
Tilapia & Catfish · Pillar 05

Cost and Returns

Feed is two thirds to three quarters of the cost, and most of it is imported and dollar-priced. The margin is won on feed and survival.
Cost, Returns and Economics · Pillar 05

Strip fish farming down to its money and one number swamps the rest: feed is two-thirds to three-quarters of what a cycle costs. That single fact reshapes the whole business.

A well-run cage returns strongly, but Ghana is a high-cost producer, so the money is made or lost on three levers only, feed price, survival and fish price. This pillar builds the indicative cost-and-returns model, shows what actually moves the profit, and reads the governance lesson from schemes that promised returns no fish farm can pay.

~77%
of a small-scale cage's cost is feed, the biggest lever by far (Magna et al., 2023)
GH¢127,261
indicative net return on a well-run Lake Volta cage cycle
1.47
benefit-cost ratio, about GH¢1.47 back for every GH¢1 spent
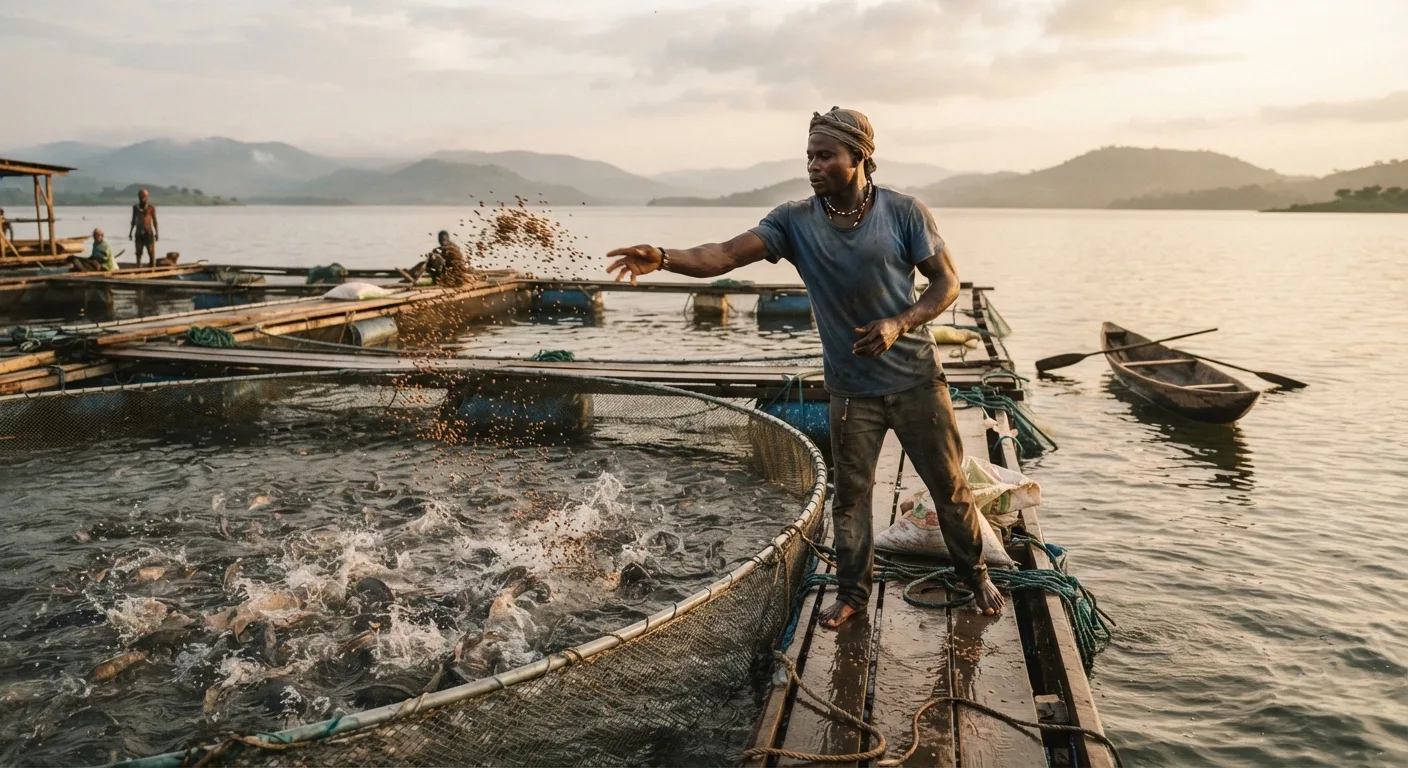
A Ghanaian cage-farm worker broadcasting floating feed pellets by hand across a tilapia cage on Lake Volta at dawn, fish boiling to the surface, still water and distant hills
Feed is the whole story
A feed-and-survival trade in a farming costume: what a cycle costs, and what it earns.

🐟 Where the money goes: feed is almost the whole story 🐟

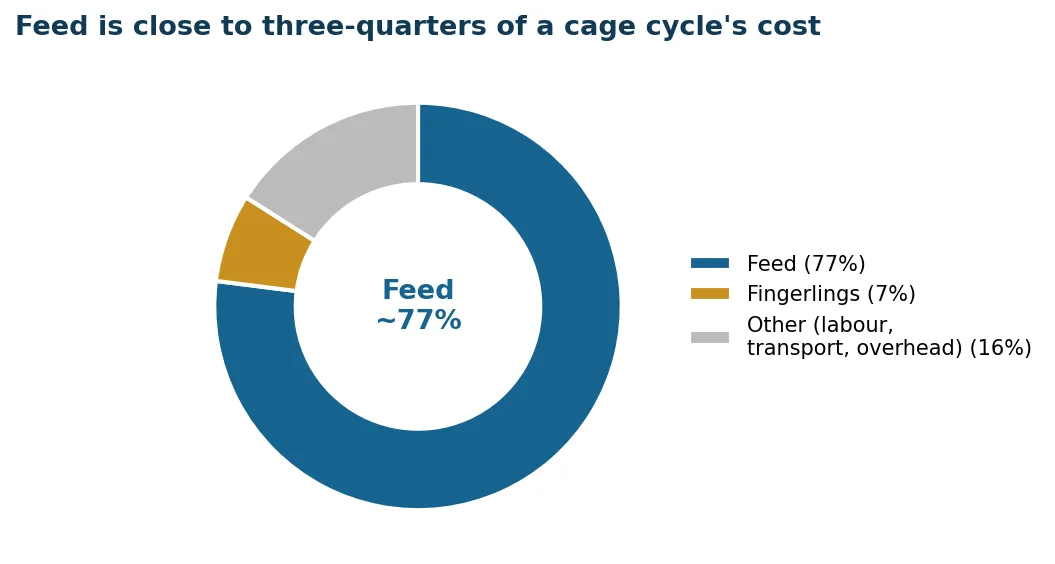
Where the money goes in a cage cycle: feed dwarfs every other cost line combined
Figure 14 Where the money goes in a cage cycle: feed dwarfs every other cost line combined

Feed is close to two-thirds to three-quarters of the cost of a cycle. Everything else, added together, moves the profit less than the feed bill does.

Source: Magna et al. (2023).

Before any model, understand the shape of the cost. Feed is about 60 to 80 percent of the cost of raising fish, close to 77 percent on small-scale cages, the single biggest cost lever (Magna et al., 2023). Nothing else comes close. Fingerlings, cages, labour, equipment and health inputs added together are a minority of the bill; the feed sack is the business. This is why fish farming is really a feed-and-survival trade wearing a farming costume.

Two numbers drive that feed bill. The first is the price of feed itself: commercial tilapia feed sells for about GH¢11 to 14 a kilogram, local small-scale feed for about GH¢4 to 5, and imported feed runs about 30 percent dearer (De Heus and Koudijs pricelist, 2024). The second is how efficiently the fish turn feed into flesh: cage tilapia runs a feed conversion of about 1.5 to 2.0 on floating pellets of about 28 to 45 percent protein by fish size (WorldFish; FAO feed management, n.d.). Multiply a high feed price by an average conversion ratio and you have the number that decides whether a cage makes money.

60 to 80%
of production cost is feed, close to 77 percent on small-scale cages
1.5 to 2.0
feed conversion for cage tilapia, kg feed per kg fish (WorldFish; FAO)

What this means. Because feed is about three-quarters of the cost, the cheapest way to raise profit is not to sell fish for more, it is to spend less on feed per kilogram of fish grown. That means two things an entrant can act on: buy or make cheaper reliable feed, and stop wasting the feed you have. A farmer who cuts the feed bill by a tenth moves the whole cost line more than one who negotiates a better farm-gate price. Feed is the lever; everything else is a detail.

🐟 The indicative cage cost-and-returns model 🐟

Here is the centrepiece: an indicative per-cycle model for a small-scale Lake Volta cage. The anchor is a peer-reviewed farm survey. A small-scale Lake Volta cage returns about GH¢127,261 a cycle on revenue of about GH¢395,231, a benefit-cost ratio of about 1.47 and a return on investment of about 47 percent (Magna et al., 2023), and feed is about 77 percent of that cost (Magna et al., 2023).

Around those measured totals the table below builds a line-item breakdown so an entrant can see where each cedi goes. Read it as a shape, not a quote: the headline totals and the feed share are from the study, but the individual line values are illustrative estimates split out from the study's cost shares and must be confirmed with your own site's prices before you bank on them.

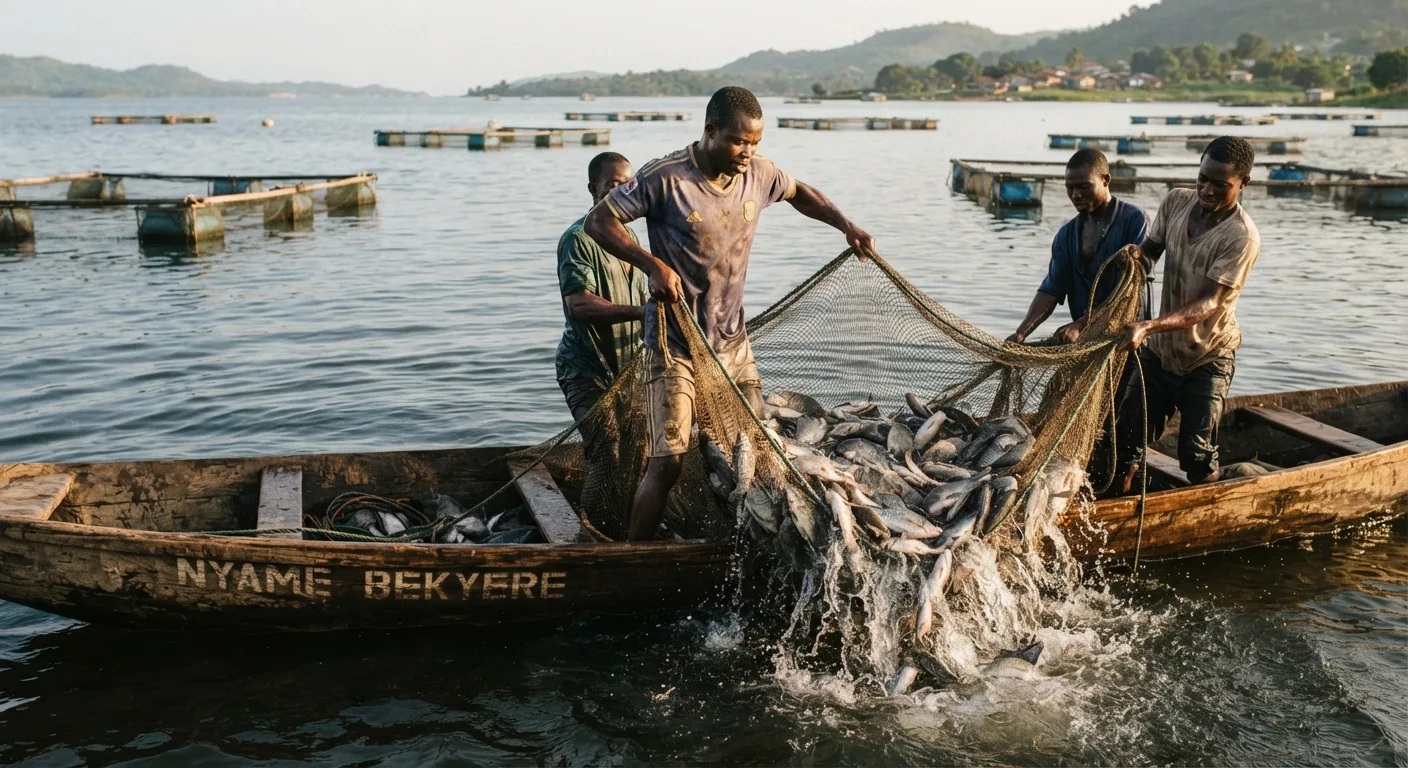
Ghanaian fish farmers hauling a cage net full of harvest-size tilapia up out of Lake Volta into a wooden boat, water streaming off the silver fish, morning light
Revenue about GH¢395,231
What the surviving fish fetch: survival and fish price set the revenue line.
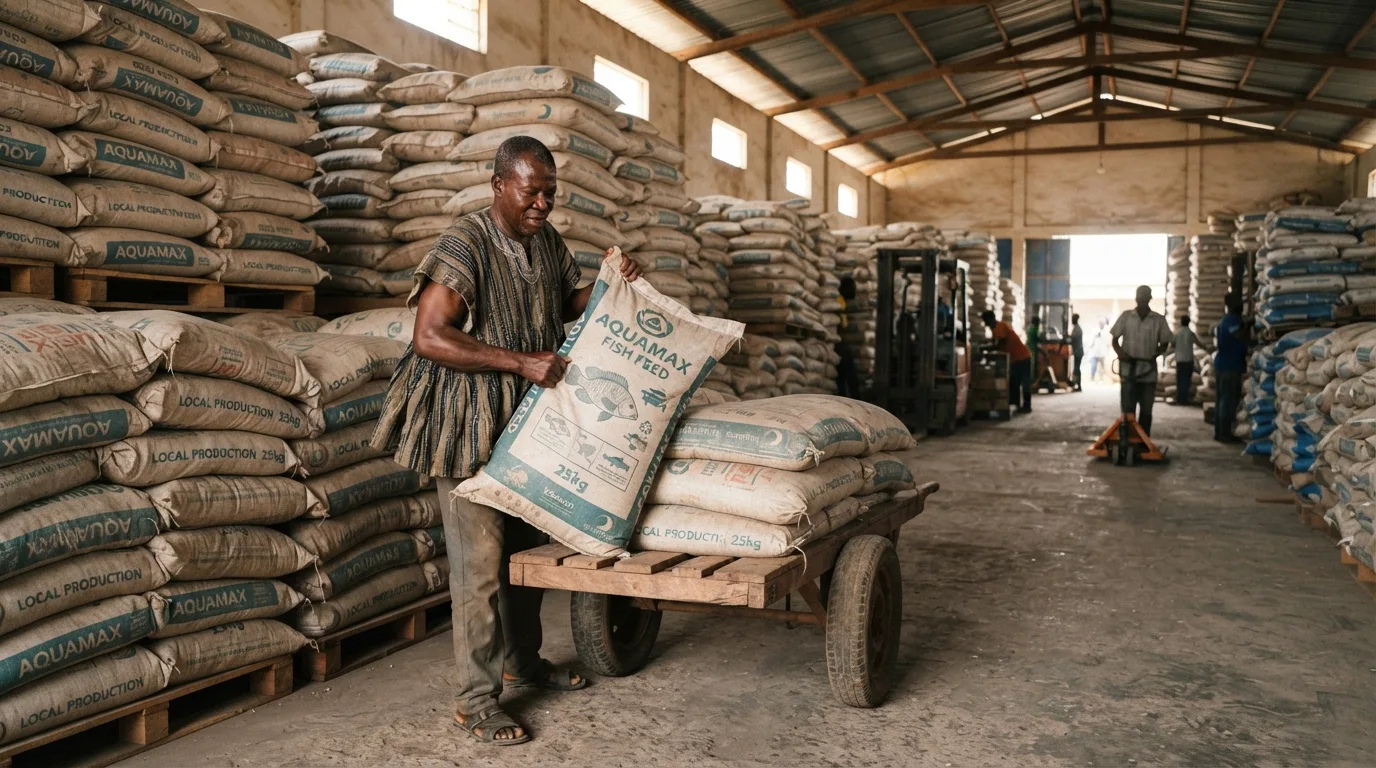
Stacked sacks of commercial tilapia feed in a Ghanaian aquaculture feed store
The biggest cost, up front
The feed sack is the business: commercial feed runs about GH¢11 to 14 a kilogram.
~47%
return on investment per cycle, before the governance warning
~98.86%
of total cost is variable: cheap to own, expensive to run
Table 6: Indicative per-cycle cost-and-returns model for a small-scale Lake Volta tilapia cage
Line itemIndicative GH¢ per cycleWhat it means for the entrant
Fingerlings (seed)about 17,7506.62%Small in the bill, huge in the outcome: weak seed loses the cycle
Feedabout 205,90076.84%The dominant lever; every efficiency here beats every other saving
Cage preparation and netsabout 26,0009.70%The second cost line; nets wear and are re-bought each cycle
Labour, fish health and other operatingabout 17,000about 6.3%Thin on paper, but skipping health inputs is how cycles die
Equipment and fixed assetsabout 1,3700.51%Boats and gear spread over years; barely moves the cycle cost
Total cost of productionabout 267,970100%Almost all of it variable, so cost scales straight with volume
Revenue (harvest sold)about 395,231n/aWhat the surviving fish fetch; survival and fish price set this
Net return per cycleabout 127,261BCR about 1.47Roughly GH¢1.47 back for every GH¢1 spent, when it works
Return on investmentabout 47% per cyclen/aA strong return, but read the governance warning further down

Field-validate: the per-line cedi figures are built out from the study's cost shares to show the shape of the bill, not measured line values. The headline totals, the feed share, the benefit-cost ratio and the return on investment are from the study.

Source: Magna et al. (2023) for revenue, total cost, net return, BCR, ROI and cost shares. Red cells are illustrative line-item estimates split from those shares, not measured values.

Market signal, a cheap-to-own, expensive-to-run business. Notice that variable costs are almost the entire bill and fixed assets barely register. That is the cage model in one line: it is cheap to own and expensive to run. The consequence is that scale does not rescue a bad cost structure, because there is no big fixed cost to spread. If your feed and survival are poor, a second cage just doubles the loss. Fix the running costs first, then grow.

🐟 Model it yourself 🐟

Numbers on a page are one thing. Move the levers yourself. Set the feed price, the feed conversion ratio, survival and the fish price to your own field numbers, add cages, and watch the benefit-cost ratio and the net return move in front of you.

Tool 1

Build a cage cycle

Slide the drivers that decide a single 125 m³ Lake Volta cage stocked at 50 fish per cubic metre, harvested at about 350 g over a six-month cycle. Overwrite every number with your own site prices.

GH¢31.1
Cost per kg of fish grown
GH¢78,750
Revenue, 1,750 kg sold
1.45
Benefit-cost ratio (revenue over cost)
+GH¢24,375
Net return per cycle, 45% return on investment
A real, attractive return when it works. Feed price and survival move it most, because feed sits on top of three-quarters of the cost and every fish that dies has already eaten feed you paid for. Push feed conversion and survival first; chase the fish price last.

Indicative planning frame, not audited data. Base case: feed about GH¢15/kg, feed conversion about 1.7, survival about 80 percent, farm-gate about GH¢45/kg, one 125 m³ cage stocked at 50 fish/m³ (single-cage build anchored to Magna et al., 2023 cost shares).

Tool 2

Where the money goes

The same cycle, split into its parts. Feed is about three-quarters of the cost, close to 77 percent in the Magna anchor, which is why a small gain in feed efficiency beats a large saving on anything else.

FeedGH¢44,625

About three-quarters of the bill and the biggest profit lever. Cut the price per kilogram or the feed wasted and the whole cost line moves.

82% of cost
Fingerlings (seed)GH¢3,750

Small in the bill, huge in the outcome: weak seed loses the cycle before the feed is even bought.

7% of cost
Everything elseGH¢6,000

Cage preparation, nets, labour, fish health and amortised equipment. Thin on paper, but skipping health inputs is how cycles die.

11% of cost
82%
Feed as a share of total cost, the one line to attack first
89%
Feed and seed together, the two levers an owner controls
Variable costs are almost the whole bill and fixed assets barely register: the cage model is cheap to own and expensive to run. Scale does not rescue a bad cost structure, because there is no big fixed cost to spread. If feed and survival are poor, a second cage just doubles the loss. Fix the running costs first, then grow.

Non-feed, non-seed lines held at about GH¢6,000 a cage (cage preparation, nets, labour, fish health, amortised equipment). Cost shares after Magna et al. (2023); single-cage levels indicative for 2026 and needing field validation.

🐟 What moves the profit most: feed price, then survival, then fish price 🐟

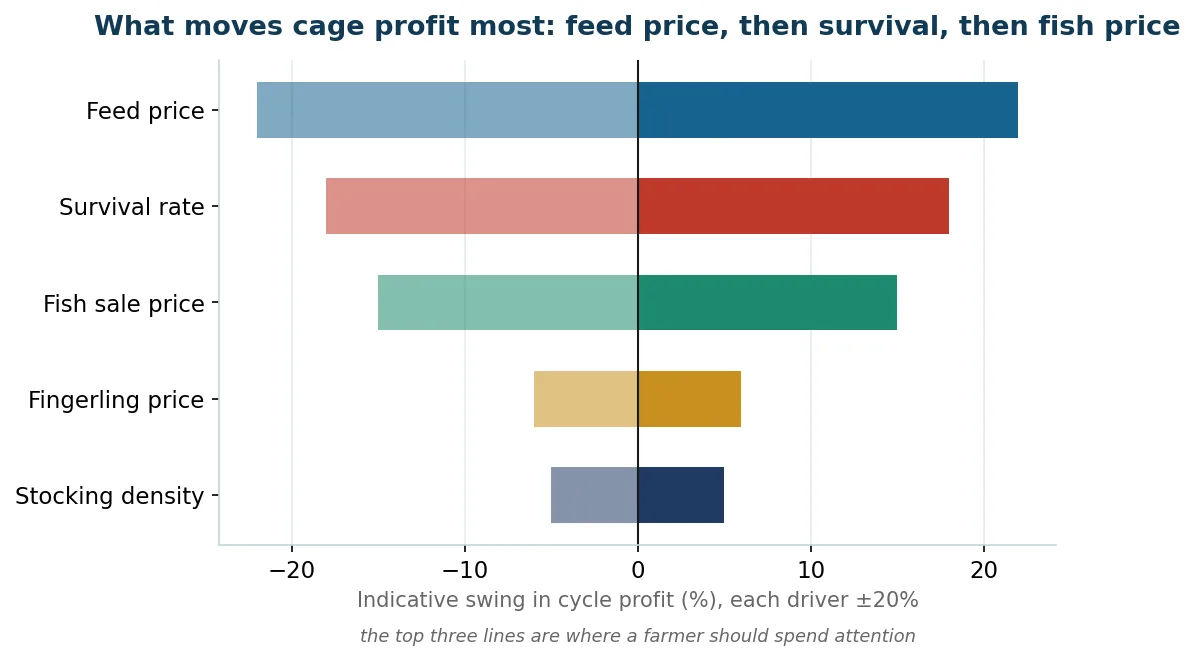
What moves the profit: the cage result is most sensitive to feed price, then survival, then fish price
Figure 15 What moves the profit: the cage result is most sensitive to feed price, then survival, then fish price

The profit of a cage is most sensitive to feed price, survival and fish price, in that order. These three lines are where a farmer should spend attention.

Source: Author sensitivity model on Magna et al. (2023) cost shares.

If feed is the biggest cost, three levers between them decide the profit, and they do not matter equally. The first is feed price and efficiency, because it sits on top of three-quarters of the cost, so a small move in feed cost per kilogram of fish swings the result more than anything else.

The second is survival: every fish that dies has already eaten feed you paid for, so a mortality is a double loss, the feed spent and the revenue never earned, which is why disease and water management (Pillars 3 and 4) are economic questions, not just biological ones. The third, and weakest of the three, is fish price, because a farmer is largely a price-taker at the farm gate. The order is the strategy: manage feed and survival first, chase price last.

2 of 3
top levers, feed and survival, are the two an owner controls from inside the cage
feed, then survival
the order the cage result is most sensitive to, before fish price (Figure 15)

What this means. This ranking tells a first-time farmer exactly where to put their scarce attention. Do not open by negotiating a better selling price, which is the lever with the least give. Open by locking cheaper, reliable feed and by protecting survival with good seed, clean water and disciplined feeding. Those two levers sit on the biggest numbers in the model, and they are the two an owner can actually control from inside the cage.

The digital angle on the biggest cost. Because feed is the lever that moves profit most, the cheapest technology in the sector is anything that stops feed being wasted. Simple feeding-record and ration-estimator apps, and at commercial scale automatic feeders, cut the feed bill and lift the feed conversion that sits under it. This is the clearest place where a digital tool pays for itself on the cost line, and the feasible-now options are set out in Pillar 8.

🐟 Why Ghana costs more than Bangladesh, Egypt and China 🐟

Now the uncomfortable number. Ghana is a high-cost producer. It costs about US$1.51 to produce a kilogram of tilapia in Ghana, against about US$0.78 to 1.29 in Bangladesh, Egypt and China (Ragasa, in CGIAR, 2024). That gap is not bad farming, it is structural: feed ingredients and often the feed itself are imported and taxed, seed is scarce, survival is dragged down by disease, and the sector lacks the scale that lets Asian and Egyptian producers buy feed cheaply.

The strategic conclusion is blunt. Ghana cannot win a price war against imported frozen fish or against low-cost exporters, so a farmer who tries to compete on price alone is fighting on the one ground where they are weakest. The competitive ground that is winnable is freshness, a live or same-day fish that no frozen import can match, and trust, a branded, traceable, locally raised product for buyers who will pay for it.

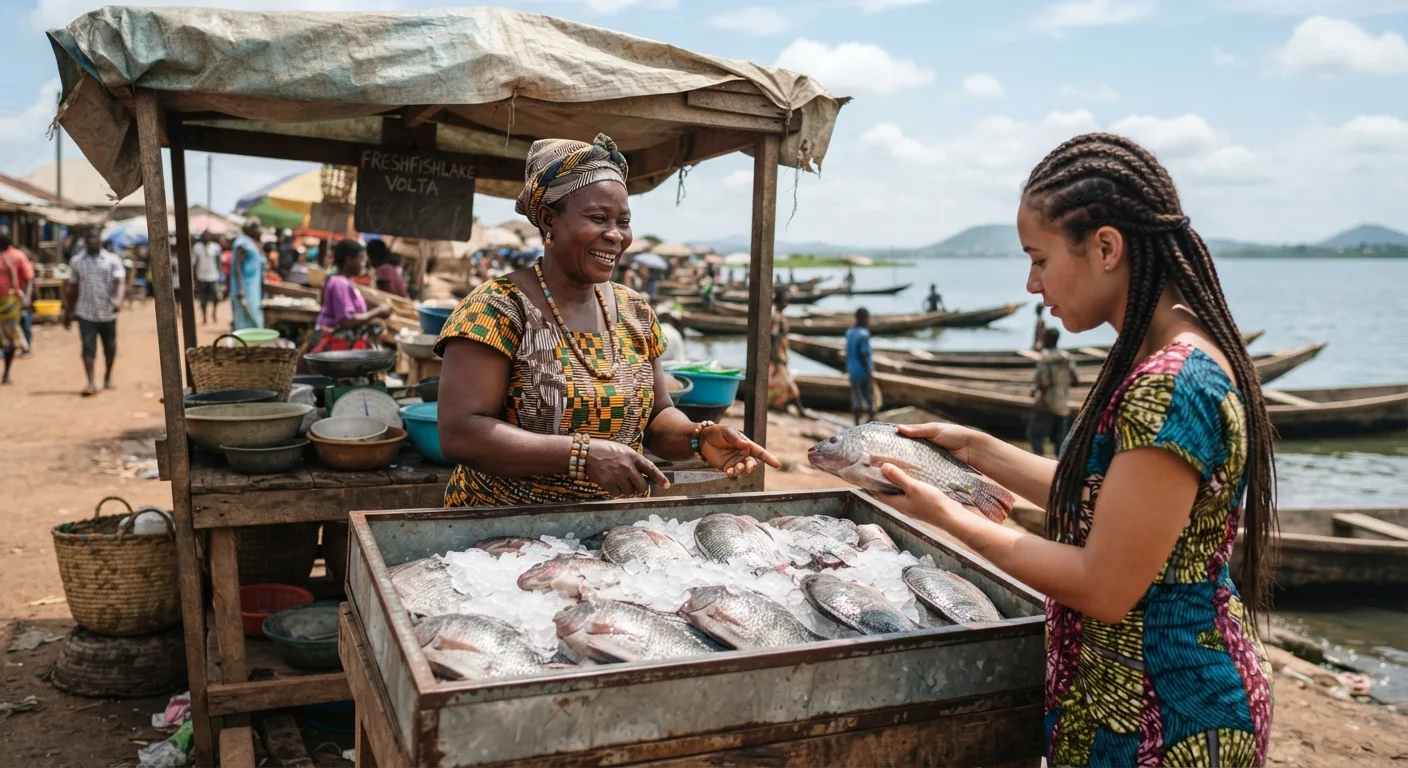
A Ghanaian market woman selling glistening fresh whole tilapia on ice at a lakeside stall, a customer inspecting a fish, bright daylight, no frozen cartons
The import cannot match fresh
Winnable ground: freshness and a trusted local brand, not the low-price shelf.
US$1.51/kg
to produce tilapia in Ghana, against US$0.78 to 1.29 abroad (CGIAR, 2024)
~54% / ~56%
of farmers struggle to access inputs and markets (CGIAR, 2024)

Market signal, compete on freshness and brand, not price. Do not price your fish against the imported frozen carton; you will lose. Price it as a different product. Local fresh tilapia sells well above the landed frozen price precisely because freshness, a live catfish, or a known local brand are things the import cannot offer. The strategy that follows from a high cost base is to compete on freshness, quality and brand, and to sell into the market lanes, restaurants, live trade and quality-conscious households, where those attributes are worth paying for. Chasing the low-price shelf is a losing game for a high-cost producer.

🐟 The governance lesson: returns that were too good to be true 🐟

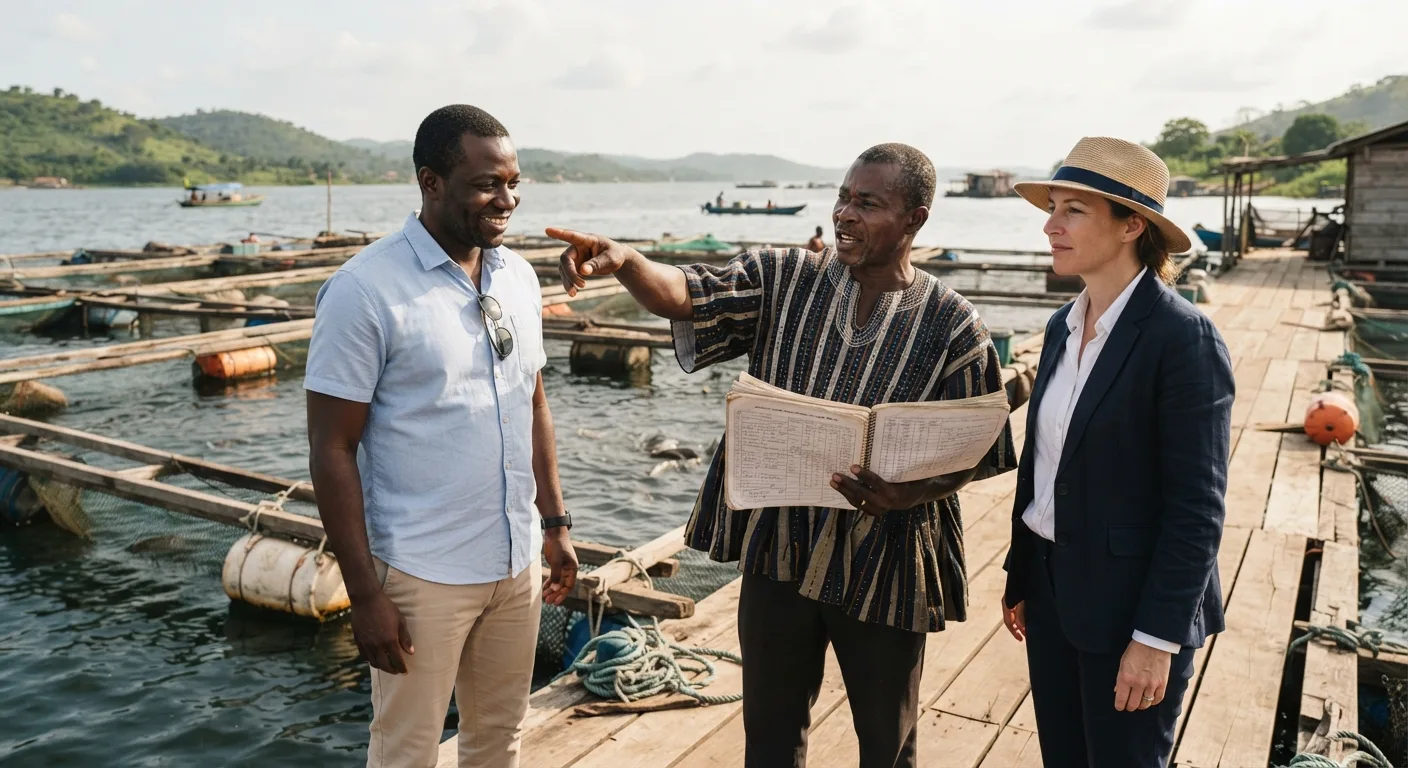
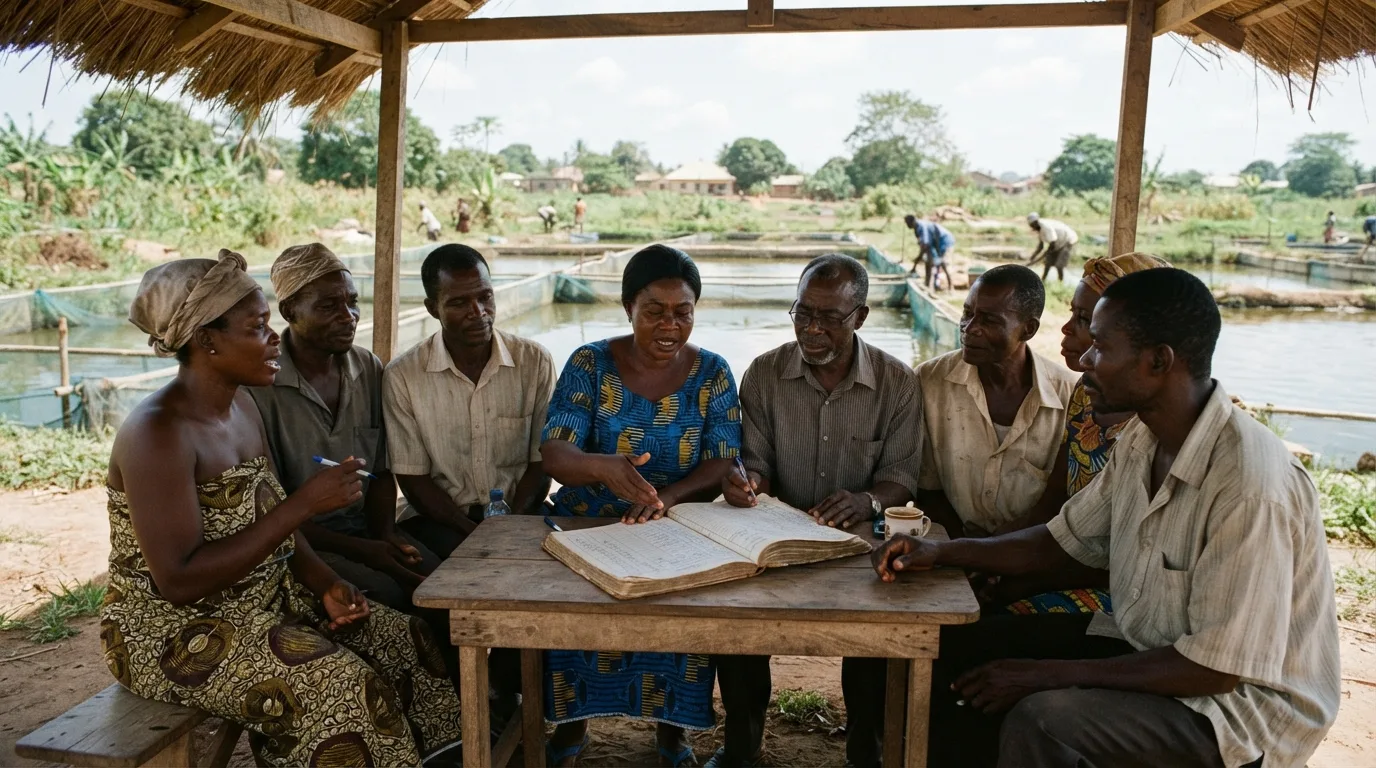
A Ghanaian fish-farm owner showing a record book and pointing at cages on Lake Volta to two visiting investors in smart-casual clothes, documentary daylight
Judge the cycle, not the brochure
36 percent a cycle is a fine business: 48 to 80 percent a year is a broken promise.

The model above shows real, attractive returns, and that is exactly where the danger sits. Well-run farms return about 36 percent a cycle, close to 72 percent a year, yet pooled schemes that promised 48 to 80 percent went insolvent (Adanu and Adanu, 2017). Read that sentence twice.

A well-run farm genuinely returns something like 36 percent a cycle, close to 72 percent a year, which is a fine business. But pooled schemes that packaged those farms and promised investors 48 to 80 percent a year could not pay it, because the farm underneath simply does not throw off that much cash once feed, mortality and the occasional failed cycle are counted. The promise, not the farming, is what broke them. This is the single most important warning in the pillar for anyone putting money in rather than fish in the water.

~36%
a cycle, close to 72 percent a year, what a well-run farm really returns
48 to 80%
a year promised by pooled schemes that then went insolvent (Adanu and Adanu, 2017)

What this means. A fish farm is a real business with real, cyclical, weather-and-disease-exposed returns, not a fixed-yield investment product. If a scheme offers you a guaranteed high annual return from tilapia, walk away: the underlying farm cannot reliably pay it, and the ones that promised it went insolvent. Judge any aquaculture investment against the honest cycle economics in the model above, per cycle, with survival and feed price stress-tested, not against a headline yield in a brochure.

The constraint around the model, getting inputs in and fish out. The model assumes a farmer can buy what they need and sell what they grow. In Ghana, both are contested. About 54 percent of farmers struggle to access inputs and about 56 percent to access markets (Ragasa, in CGIAR, 2024). These are not footnotes to the economics; they are the economics. A farmer who cannot get affordable feed and seed when they need them runs a worse feed bill and a worse survival rate, the two levers that matter most, and a farmer who cannot reach a good market becomes a price-taker to whoever will buy, surrendering the third lever too. The cost model is only as good as the input and market access around it, which is why the value chain and the entry routes (Pillars 6 and 8) are where the model is actually defended.

🐟 The Opening: cost and returns 🐟
01

Reliable, cheaper feed supply. Because feed is three-quarters of the cost and over half of farmers struggle to access inputs, anyone who can deliver affordable, consistent feed sits on the sector's biggest cost lever and its biggest access gap at once.

02

Input finance and bundled supply. Working capital to buy a full feed cycle up front, repaid at harvest, directly relieves the input-access constraint that quietly wrecks smallholder economics.

03

Aggregation and offtake that gives the farmer a market. Guaranteed, fair offtake converts a price-taker into a planner and lets the model's returns actually land (see Pillar 6).

🐟 The risks that sit inside the economics 🐟

Feed is two-thirds of the cost

VERY HIGH
What it is

Feed is about 77 percent of a cage cycle's cost, so the whole business is exposed to one input. A feed-price rise, a currency slide that lifts imported-feed cost, or sloppy feeding that wastes pellets goes almost straight to the bottom line.

Evidence

Feed is about 60 to 80 percent of production cost, close to 77 percent on small-scale cages, at commercial prices of about GH¢11 to 14 a kilogram (Magna et al., 2023; De Heus and Koudijs, 2024).

Who it hits

Every farmer, hardest on cage operators buying imported commercial feed with borrowed working capital.

How to manage it, and the opening

Attack the feed line first: measure feed conversion, cut waste, and secure cheaper reliable feed, whether local small-scale feed or a bulk contract. The mirror-image opening is a feed mill or premium local feed, because the sector's biggest cost is also its biggest under-served supply.

The working-capital and mortality squeeze

HIGH
What it is

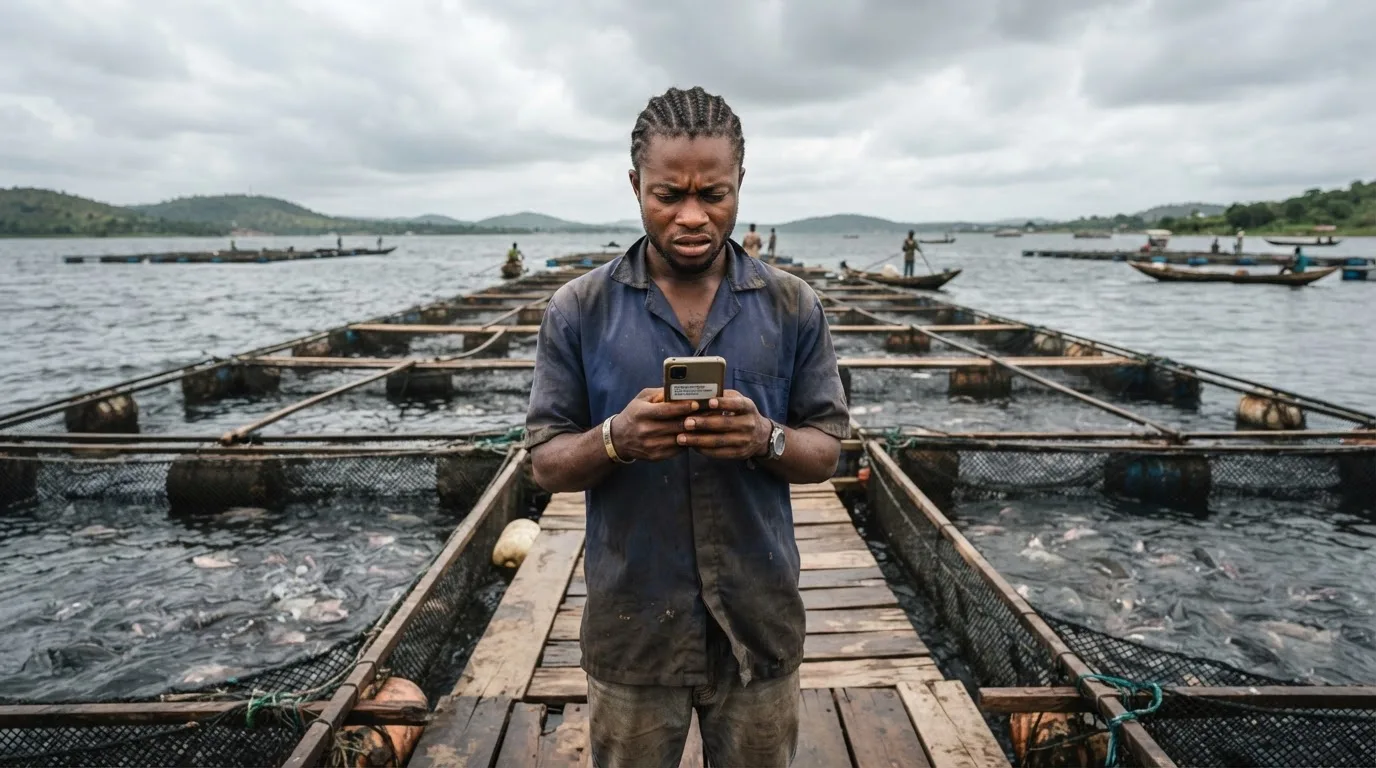
A cage eats feed for months before it earns a cedi, and every fish that dies has already been fed. So a farmer carries a large feed bill on credit, and any survival shortfall turns that feed spend into pure loss with no revenue behind it.

Evidence

Grow-out survival can fall to about 5 to 20 percent in bad conditions, and variable costs are about 98.86 percent of total cost, so cash goes out long before it comes back (Baah et al., 2026; Magna et al., 2023).

Who it hits

Thin-capital and first-time farmers who borrow to buy feed and cannot absorb a failed cycle.

How to manage it, and the opening

Size the working capital for a full cycle plus a buffer, protect survival with screened seed and water discipline, and do not scale to a second cage until the first proves its survival. Input finance and insurance-backed offtake are the openings that de-risk exactly this squeeze.

The pooled-scheme governance trap

HIGH
What it is

Schemes that pool investor money into fish farming and promise fixed, high annual returns are structurally unsound, because the underlying farm cannot reliably generate what is promised once feed, mortality and failed cycles are counted.

Evidence

Well-run farms return about 36 percent a cycle, roughly 72 percent a year, yet pooled schemes promising 48 to 80 percent a year went insolvent (Adanu and Adanu, 2017).

Who it hits

Retail investors and would-be entrants lured by brochure yields, and honest operators tarred by the failures.

How to manage it, and the opening

Judge any scheme against the real per-cycle economics, stress-tested for survival and feed price, and treat a guaranteed high yield as a red flag, not a selling point. The legitimate opening is transparent, cycle-honest financing and contract farming that shares real risk rather than promising fixed returns.

🐟 Key takeaways 🐟
01

Feed is two-thirds to three-quarters of the cost, close to 77 percent on a small-scale cage. Fish farming is a feed-and-survival business; the feed sack, not the fish price, is the lever.

02

A well-run cage returns strongly, about GH¢127,000 a cycle, a benefit-cost ratio near 1.47 and a return on investment around 47 percent, but the line items must be validated with field data.

03

Profit moves most on feed price, then survival, then fish price, in that order. Manage the first two, which you control; do not open by chasing the third, which you mostly cannot.

04

Ghana is a high-cost producer, about US$1.51 a kilogram against US$0.78 to 1.29 abroad, so the strategy is to compete on freshness and brand, never on price.

05

Fixed high returns are a warning sign. Real farms pay real cyclical returns; schemes that promised 48 to 80 percent a year went insolvent. Judge investments on honest cycle economics.

Written for each reader

🐟 Practitioner intelligence 🐟

Hover any card to pause and lift it.

For students

Learn the economics as a feed-and-survival problem, because that is what it is. Before you ever run a cage, learn to calculate feed conversion and cost per kilogram of fish grown, since that one number explains three-quarters of the cost and most of the profit. Build the indicative model above on a spreadsheet and stress-test it: drop survival to a fifth, raise feed price a fifth, and watch the return collapse. That exercise teaches, in numbers, why feed and survival beat fish price, and it is the single most useful thing you can carry into a first job or a first cage.

For entrepreneurs

First move: secure cheaper, reliable feed and size your working capital for a full cycle plus a buffer, because feed is the cost and cash-out-before-cash-in is the squeeze that kills first-timers. Do not benchmark your selling price against imported frozen fish; you are a high-cost producer and will lose that fight, so sell on freshness, a live catfish or a known local brand into restaurants and quality buyers. Protect survival with screened seed and water discipline, and treat every fish that dies as feed money already burned. Prove one cage's survival and cost before you build a second.

For investors

Underwrite the feed supply and the survival record before the cages, because those two lines carry the model. Insist on per-cycle economics stress-tested for a mortality event and a feed-price rise, not a headline annual yield, and remember that Ghana's high cost base leaves thin room for error. The clearest red flag in this sector is a fixed high promised return: real farms pay cyclical returns and the schemes that promised 48 to 80 percent a year went insolvent. The thesis worth backing is the cost lever itself, feed, seed and cold-chain offtake that lower every farm's running cost, not another undercapitalised grow-out cage.

For ecosystem actors

The highest-leverage public action is anything that lowers the feed bill and lifts survival, because those are the two numbers that decide whether farms are viable: support local feed milling, affordable input finance and the seed and health systems that keep fish alive. Measure success as the delivered cost of feed per kilogram of fish and the survival rate on typical farms, not as cages distributed. And protect the sector's reputation by warning against fixed-return pooled schemes, whose insolvencies scare off the honest capital the model actually needs.

Where this connects. The feed and survival that drive this model are set by the production regime in Pillar 4 and the disease pressure in Pillar 3, so the cost line is really their outcome in cedis. The farm-gate price that ends this model is where the value-chain margin ladder in Pillar 6 begins, and the input and market-access constraints that bound it are the openings the entry strategy in Pillar 8 is built to exploit. The reason a high-cost producer must sell on freshness rather than price is the same import price ceiling explained for the market in Pillar 2.

Download full PDF
UpcomingThis document isn't available yet.